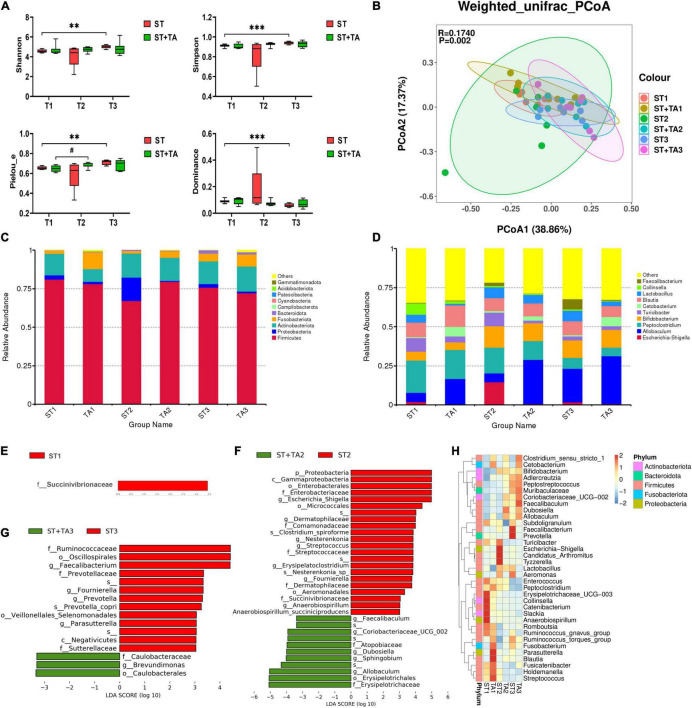
FIGURE 4.
Effect of TA on gut microbiota composition and structure in dogs. α-diversity analysis (Shannon, Simpson, Pielou_e, and Dominance) (A), principal coordinate analysis (PCoA) based on weighted UniFrac distances (B), histogram of abundance distribution at the phylum level (C) and genus level (D), the LEfSe analysis among groups (E–G), and hierarchical clustering (H). Data are presented as mean ± SE (n = 6 or 7). **p < 0.01 and ***p < 0.001 represent the difference of each group at T1–T3 calculated by RM-ANOVA. #p < 0.10 represents the difference in tendency of each group at T1–T3 calculated by RM-ANOVA. The p-values of β-diversity index in the PCoA calculated by the Wilcoxon rank sum test. T1, day 7 before transportation; T2, day 8 after transportation; T3, day 14 after transportation.

