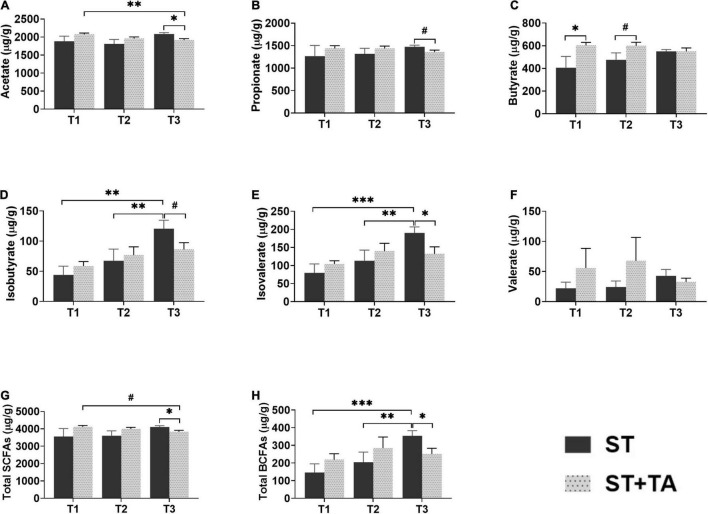
FIGURE 6.
Effect of TA on acetate (A), propionate (B), butyrate (C), isobutyrate (D), isovalerate (E), valerate (F), total SCFAs (G), and total BCFAs (H) in dogs. Data are presented as mean ± SE (n = 6 or 7). *p < 0.05, **p < 0.01, and ***p < 0.001 represent the difference calculated by Student’s t-test between the ST and ST + TA groups or the difference of each group at T1–T3 calculated by RM-ANOVA; #p < 0.10 represents the difference in tendency calculated by Student’s t-test between the ST and ST + TA groups or the difference in tendency of each group at T1–T3 calculated by RM-ANOVA. T1, day 7 before transportation; T2, day 8 after transportation; T3, day 14 after transportation. Total SCFAs (short-chain fatty acids) = acetate + propionate + butyrate; Total BCFAs (branched-chain fatty acids) = isobutyrate + isovalerate + valerate.

