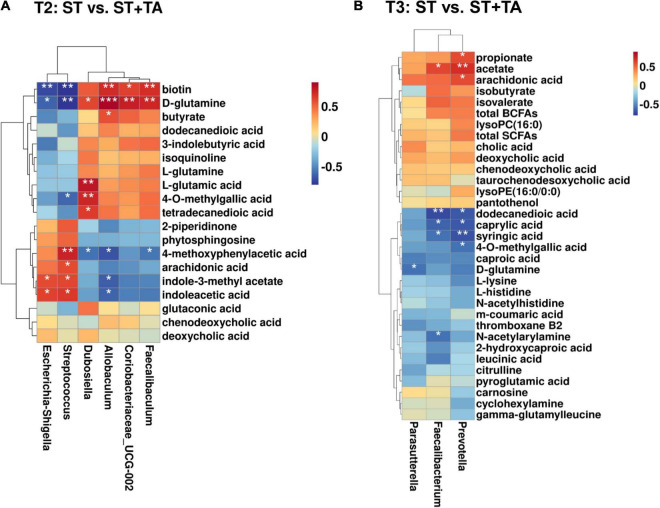
FIGURE 9.
Correlation heatmap between differential metabolites and fecal bacteria (at the genus level) at T2 (A) and T3 (B). The symbol (*) indicates a significant correlation between serum metabolites and fecal bacteria (*p < 0.05, **p < 0.01, and ***p < 0.001). Red color indicates a positive correlation, and blue color indicates a negative correlation. T2, day 8 after transportation; T3, day 14 after transportation.

