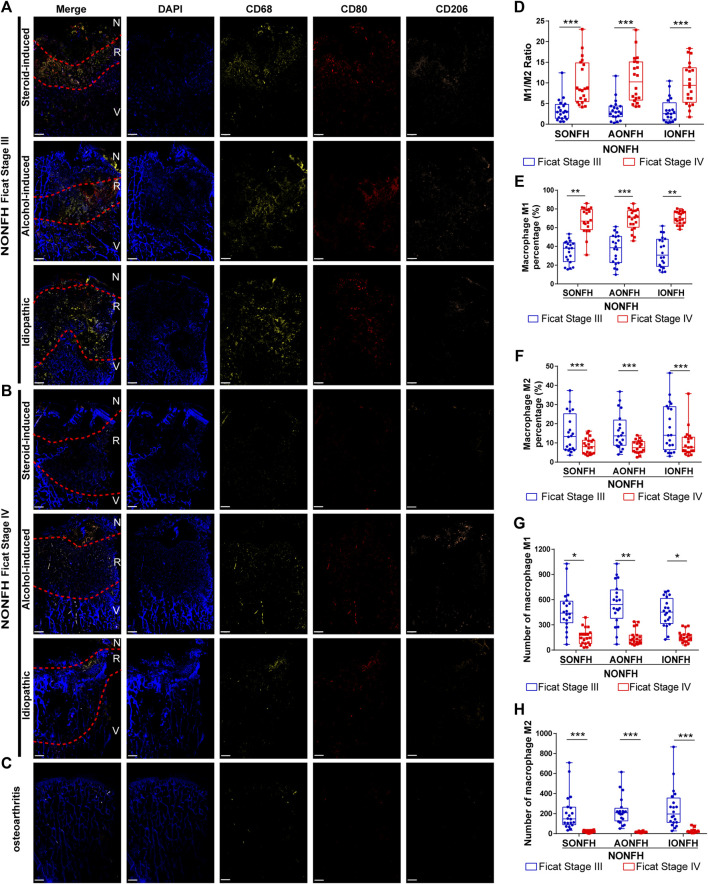
FIGURE 2.
Macrophage M1/M2 imbalance increased from progressive-stage to end-stage NONFH (A,B) Representative mIHC images of M1 (CD68+CD80+CD206-) and M2 (CD68+CD80−CD206+) macrophages in sections from patients with different types NONFH in the (A) progressive stage or (B) end-stage. Scale bar, 2 μm (C) Representative mIHC images of M1 and M2 macrophages in patients with osteoarthritis. Scale bar, 2 μm (D) Comparison of M1/M2 macrophage ratios in patients with different types and stages of NONFH (E,F) Comparison of the percentages of (E) M1 and (F) M2 macrophages in patients with different types and stages of NONFH (G,H) Comparison of the numbers of (G) M1 and (H) M2 macrophages in patients with different types and stages of NONFH. *p < 0.05; **p < 0.01; ***p < 0.001.

