
Figure 4.
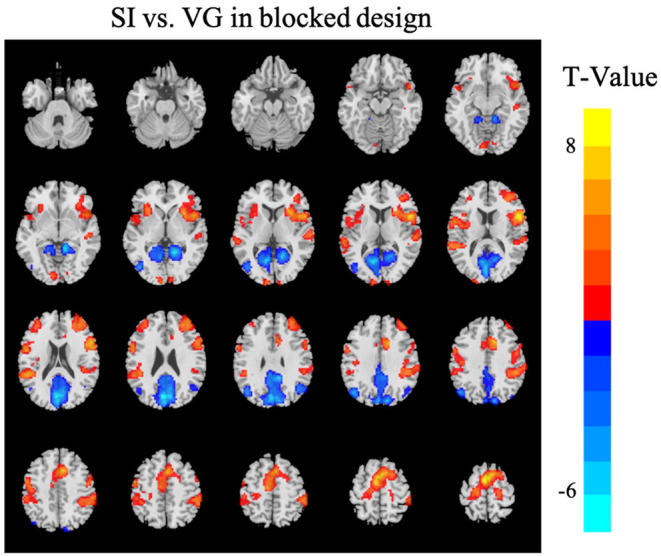
Differences in brain activations between SI and VG tasks in the blocked design [Gaussian random field (GRF) corrected with voxel p < 0.001 and cluster p < 0.05]. Warm colors (red) indicate higher brain activation or activity in the SI condition than VG; cool colors (blue) indicate higher brain activation or activity in the VG condition than SI. The Z-coordinates were from −30 to +65 with a step of 5 mm. Left in the figure is the left in the brain.