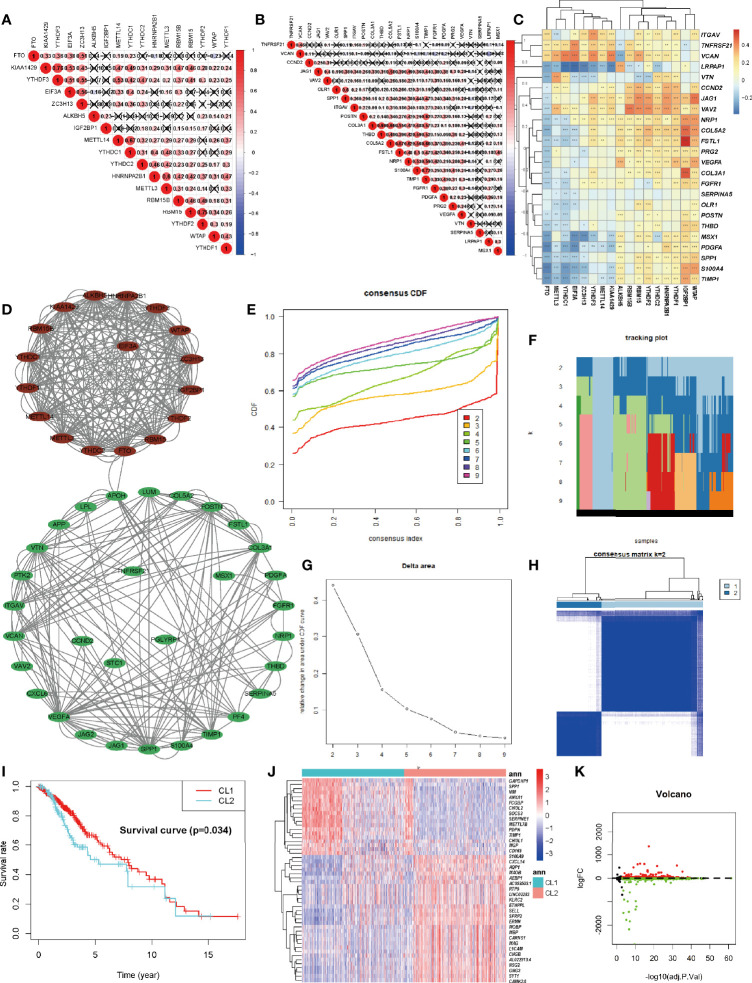
Figure 2.
Identification and Functional Enrichment of Two Clusters of LGG. (A) The m6A modification-related interactions among the studied m6A regulators. (B) The angiogenesis-related interactions among the studied angiogenesis-related genes (ARGs). (C) The correlations between each m6A regulators and the expression of each ARGs using Spearman analyses. A negative correlation was marked with blue and positive correlation with red. (D) The protein-protein interaction between ARGs and m6A regulators (MAGs). The denseness of connection lines represented the connection strength of each node. ARGs were labeled as green dots in the circle and m6A regulators were labeled as red dots in the circle. (E) Consensus clustering cumulative distribution function (CDF) for k = 2-10 in TCGA-LGG cohort. (F) Relative change in tracking plot under the CDF curve for k = 2-10 in the TCGA-LGG cohort. (G) Relative change in area under the CDF curve for k = 2-10 in the TCGA-LGG cohort. (H) Consensus clustering matrix for k = 2 in the TCGA-LGG cohort. (I) Kaplan-Meier curves for two robust clusters in the log-rank test. (J, K) Heatmap (J) and volcano map (K) of differential expressed genes between dichotomous layers based on unsupervised clustering. The asterisks represented the statistical P-value ∗P <0.05; ∗∗P <0.01; ∗∗∗P <0.001.

