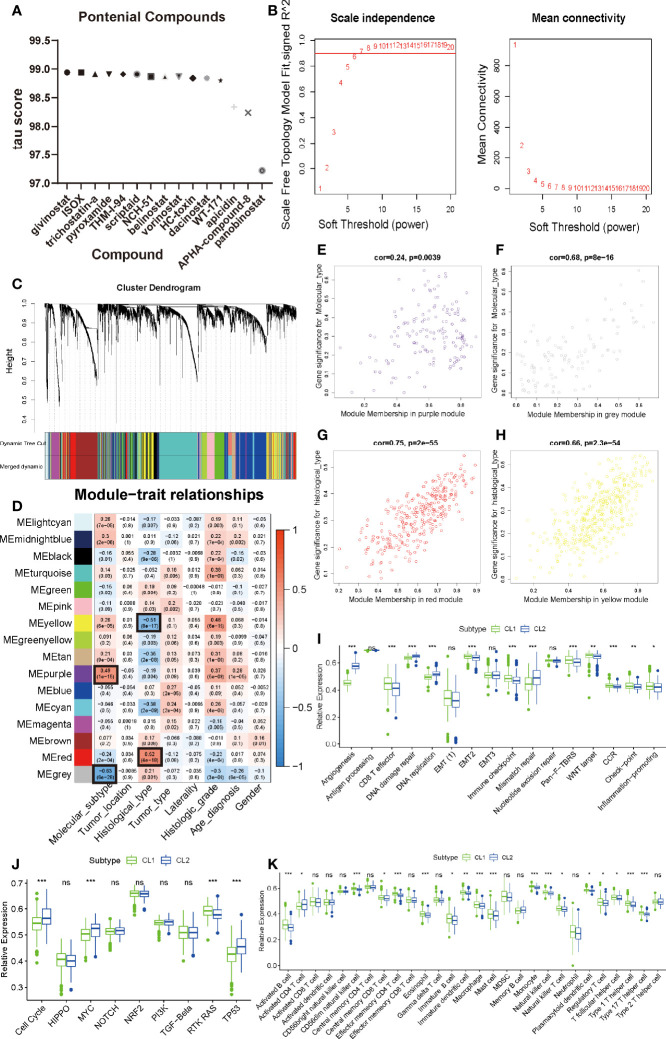
Figure 3.
Identification of meaningful modules and key genes. (A) Histogram of fourteen compounds shared the CMap mode-of-action of HDAC inhibitor, sorted by descending tau score of compounds. tau, connectivity score. (B) Determination of soft-thresholding power in weighted gene co-expression network analysis (WGCNA). (C) Hierarchical clustering dendrograms of identified co-expressed genes in modules in LGG. The branches of the cluster dendrogram correspond to the 10 different gene modules. Each leaf on the cluster dendrogram corresponds to a gene Each colored row represents a color-coded module which contains a group of highly connected genes. A total of 20 dynamic modules and 16 merged modules was identified in LGG respectively. (D) Correlations between the gene modules and clinical traits. The correlation coefficient in each cell represented the correlation between the gene module and the clinical traits, which decreased in size from red to blue. The corresponding P-value is also annotated. (E–H) Scatter plot of module eigengenes in the MEpurple module with molecular subtype (E), a MEgrey module with molecular subtype (F), a MEred module with histological type (G), a MEyellow module with histological type (H). Cor was the coefficient indices and p was Pearson’s correlation. (I–K) The enrichment differences of typical biological processes (I), oncogenic pathways (J) and immune cell infiltration abundance (K) between CL1 and CL2. The upper and lower ends of the boxes represented an interquartile range of values. The lines in the boxes represented the median value, and the dots showed outliers. The asterisks represented the statistical P-value (∗P <0.05; ∗∗P <0.01; ∗∗∗P <0.001, ns, no significant).

