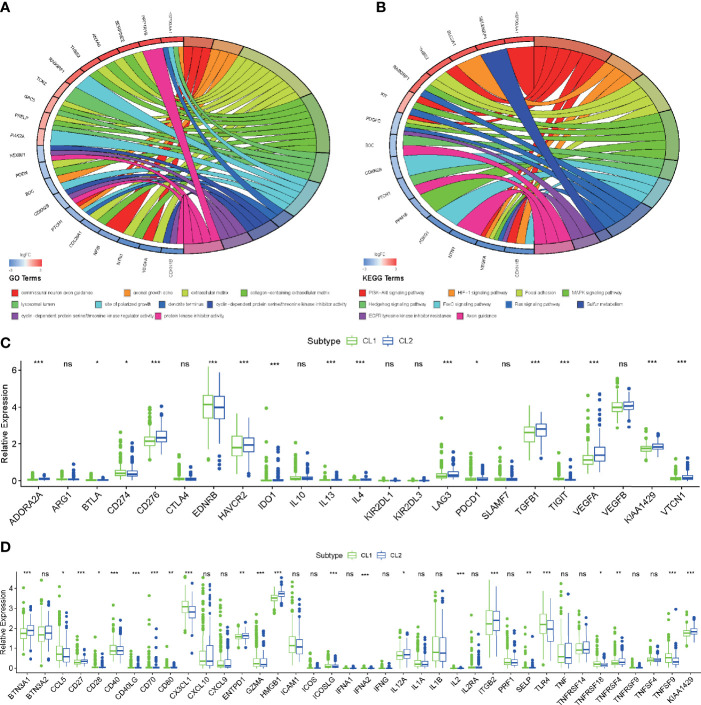
Figure 4.
Functional enrichment analysis of key genes and critical modules. (A, B) Functional annotation of the hub genes in the molecular subtype modules with GO analysis (A) and KEGG pathway analysis (B). (C, D) Differences in the expression of immunosuppressive (C) and stimulator genes (D) in the CL1 and CL2 subgroups. The upper and lower ends of the boxes represented an interquartile range of values. The lines in the boxes represented the median value, and the dots showed outliers. The asterisks represented the statistical p-value (*P < 0.05; **P < 0.01; ***P < 0.001, ns, no significant).

