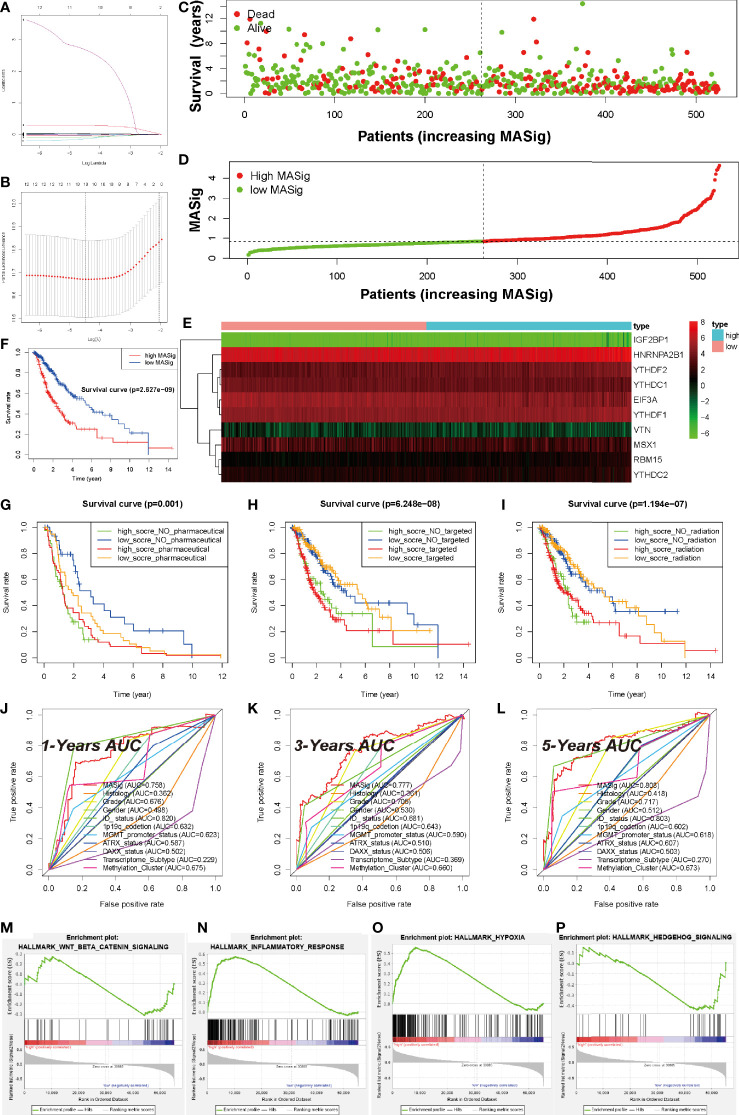
Figure 5.
Prognostic Value of MAGs in LGG. (A) Ten-time cross-validation for tuning parameter selection in the TCGA-LGG cohort. (B) Regression coefficient profiles of identified m6A regulators in the TCGA-LGG cohort. (C) The distribution of survival status of MASig. (D) The distribution of MASig (high and low) of patients with LGG. (E) The correlation and distribution of hub MAGs expression values and MASig. (F) Survival analyses for low- and high- MASig groups in TCGA-LGG cohort using Kaplan–Meier in Log-rank test. (G–I) Survival analyses for subgroup patients stratified by both MASig and treatment with pharmacological chemotherapy (G), targeted therapy (H), and radiotherapy (I) using Kaplan– Meier curves in the Log-rank test. (J–L) ROC curves with calculated area under the curve (AUC) for risk prediction in 1 (J), 3 (K), 5 (L) years in the TCGA-LGG cohort. (M–P) GSEA revealed that genes with higher expression in the CL2 subgroup were enriched for hallmarks of malignant tumors.

