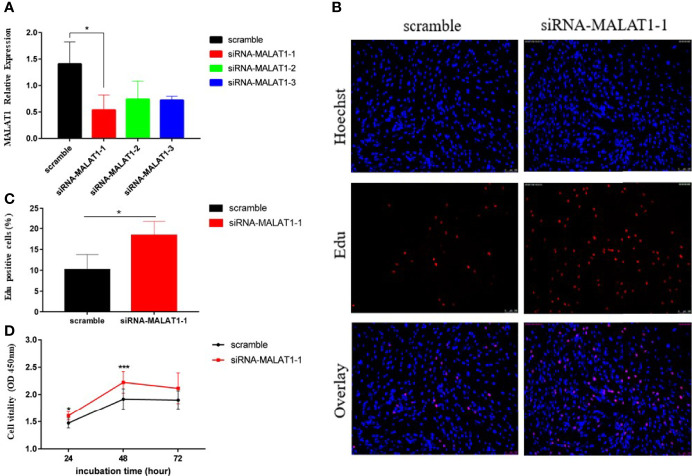
Figure 2.
Knockdown of MALAT1 promoted KGN cell proliferation. (A) Graph showing the expression level of MALAT1 in KGN cells treated with three different siRNA sequences via RT-qPCR (* p < 0.05). (B) Graphs showing the proportion of proliferation cells via Edu assay in granulosa cells treated with the most efficient siRNA sequence in (A). The amount of cells was detected by staining with Hochest (blue), as the proliferated cells were detected by staining with EdU (red). The result was analyzed by fluorescence microscope. (C) Graph showing the percentages of EdU-positive cells (* p < 0.05). (D) Graph showing the viability of KGN cells treated with siRNA-MALAT-1 was measured by using Cell Counting Kit-8 at the indicated time points (* p < 0.05; *** p < 0.01).

