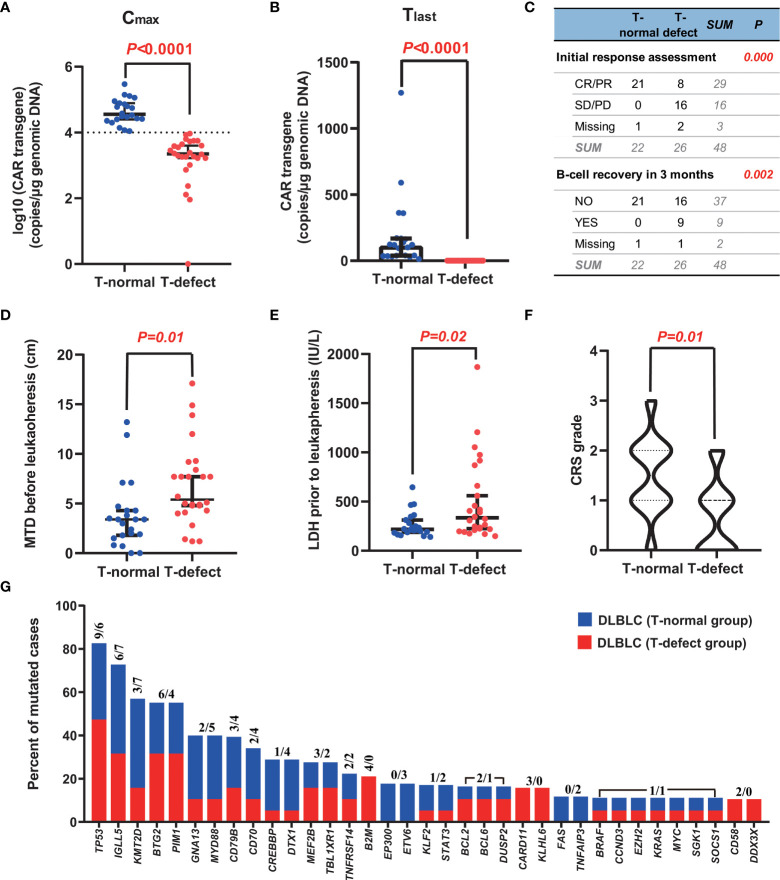
Figure 2.
Typical characteristics of the two groups. (A, B) CAR T-cell expansion (Cmax) and persistence (Tlast at +3 months) in peripheral blood were greater in the T-normal group than in the T-defect group (p<0.0001). (C) The initial response to CAR-T cell therapy was also considerably better in patients with T-normal function than in those with T-defect function (p<0.0001). In addition, there were significant differences in B-cell recovery in the T-normal group compared with the T-defect group (p=0.002). (D, E) MTD and LDH level in the T-normal and T-defect groups before leukapheresis demonstrate significant differences (p=0.01, and 0.02, respectively) according to the Mann-Whitney Test. (F) The T-normal group showed higher CRS grades than the T-defect group according to a Pearson chi-square test (p=0.01). (G) Recurrent somatic mutations in DLBCL. Shown is the prevalence of the indicated genetic abnormalities in 57 genes in the T-normal group (in blue) and T-defect group (in red). The two numbers for each mutation represent the counts of individuals carrying the genetic alterations in the T-defect and T-normal groups, respectively. The somatic origin of the mutations was confirmed by analysis of paired PBMC germline DNA. CAR, chimeric antigen receptor; CR, complete remission; CRS, cytokine release syndrome; PD, disease progression; PR, partial remission; SD, stable disease; SNP, single nucleotide polymorphism; MTD, maximal tumor diameter.

