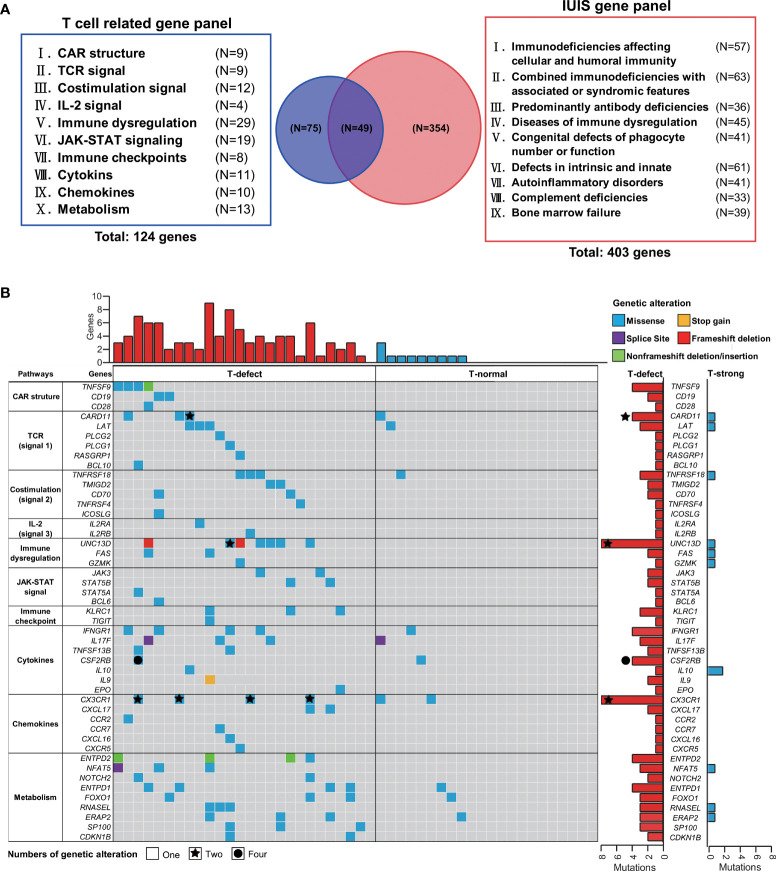
Figure 3.
Targeted gene panel of T-cell functions and waterfall plot of germline mutations. (A) One hundred and twenty-six target genes, including ten T-cell and CAR-T cell biology categories, were selected for the waterfall plot with T-cell grading information. Fifty genes were identical to primary genetic defects reported by the IUIS/WHO committee. (B) The top 47 mutated genes that differed between the two groups, such as TNFSF9, CD19, CARD11, UNC13D, and CX3CR1, were selected for the waterfall plot with T-cell group information. The genes were arranged according to the T cell-related gene panel in (A). Each column corresponds to a sample, and cases are ordered by the lymphoma with T-defect on the left (red bar) and with T-normal (blue bar) on the right. The types of genetic alterations are shown as different colors as shown in the legend in the upper-right corner. The counts of genetic alterations are shown as none, stars, and circles, representing once, twice, and four times person-times, respectively. CAR, chimeric antigen receptor; JAK-STAT, Janus kinase-signal transducer and activator of transcription; IL-2, interleukin-2; IUIS, International Union of Immunological Societies; TCR, T-cell receptor; WHO, World Health Organization.

