FIGURE 4.

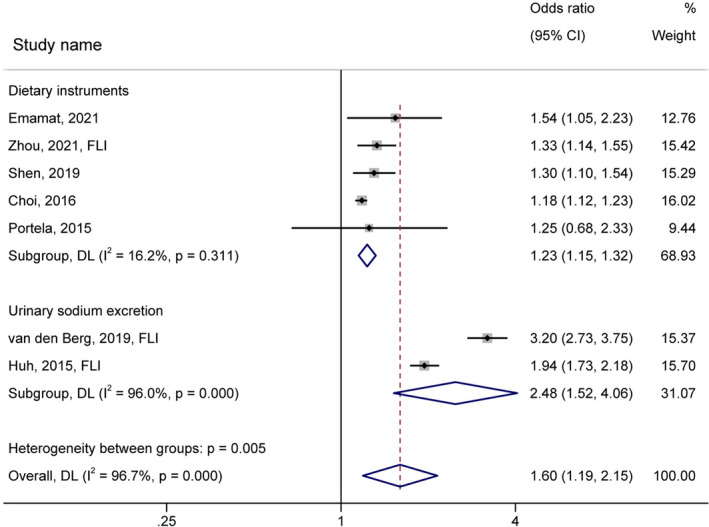
Forest plot (random‐effects model) depicting the association of salt/sodium intake (highest vs.. lowest category) and risk of nonalcoholic fatty liver disease subgrouped by sodium intake measurement tools

Forest plot (random‐effects model) depicting the association of salt/sodium intake (highest vs.. lowest category) and risk of nonalcoholic fatty liver disease subgrouped by sodium intake measurement tools