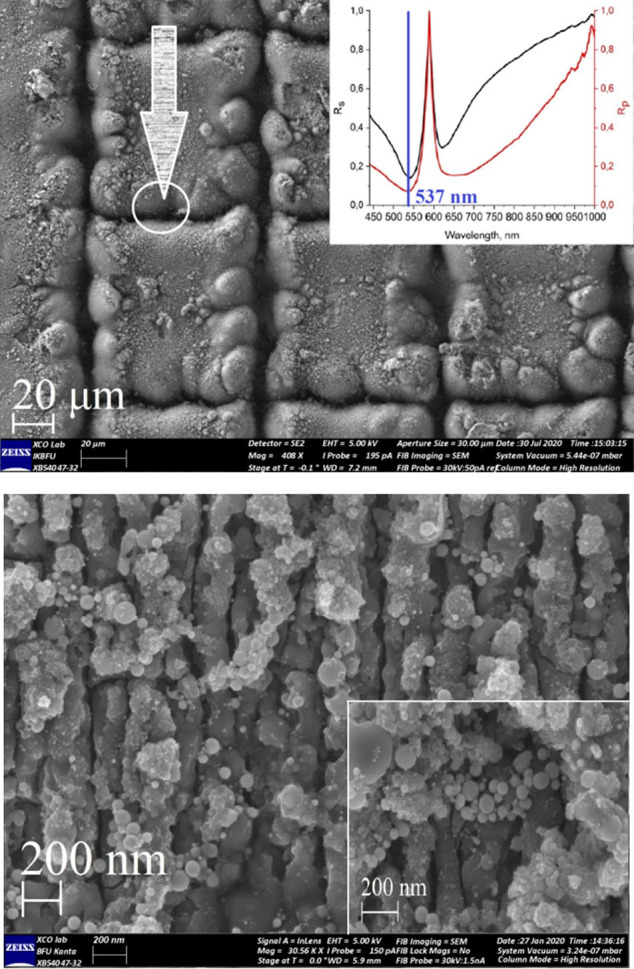
Fig 1. SEM images of the SERS surface in “grating’ geometry on the titanium plate.

20 μm scale (a) with Au NPs and 1 μm scale (b), 200 nm scale (b, inset) with Au NPs. 1a (inset) illustrates results for spectral ellipsometry experiments for Ti/Au surface.
