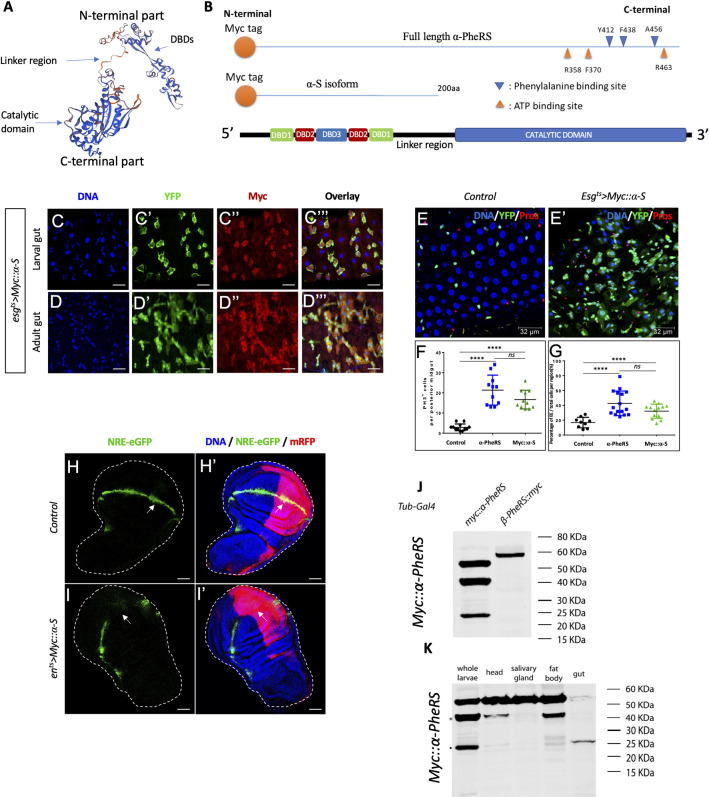
Fig 6. The N-term of α-PheRS (α-S) is sufficient to induce the proliferative phenotype and repress Notch activity.
(A) 3D model of the α-PheRS structure (suggested by SWISS MODEL tool https://swissmodel.expasy.org/) also shows that the catalytic module and the winged DBDs are separated from each other by a linker strand. (B) Schematic illustration of the α-PheRS polypeptide with its ATP and phenylalanine binding residues. α-PheRS has the catalytic domains located in the C-terminal part and the DNA binding domains (DBD-1,2,3) located in the N-terminal region. The Myc tagged α-S construct lacks all core domains of α-PheRS but encodes the first 200 codons of the α-PheRS ORF under UAS control. (C,D) Myc::α-S was expressed using the esgts system in adult and larval midguts and this led to similar phenotypes as elevated expression of α-PheRS(Cys) in the same system (esgts/UAS-Myc::α-S). (E-E’,F,G) Quantification of PH3+ cell numbers (F) and the proportion of EE per total cell number (G) in the intestinal region analyzed. In all experiments, EEs were visualized with the anti-Prospero antibody, YFP-/Hoechst+ polyploid cells were counted as ECs. Animals were mated at 18°C, and adults of the required genotypes were collected and shifted to 29°C to inactivate Gal80ts. Adult midguts were dissected from female flies after 5 days of induction at 29°C. At least 10 guts were analyzed for each genotype. n = 10, **p<0.01, ***p<0.001, ****p<0.0001 in ANOVA tests. (H, I) Elevated Myc::α-S leads to the loss of NRE-eGFP expression in the posterior compartments, similar to the effect of α-PheRS(Cys). The same system and experimental setups were used as in Fig 5B–5E (w,UAS-Dcr2/+;en-Gal4,UAS-mRFP,NRE-eGFP/+;tub-Gal80ts/UAS-Myc::α-S). (J, K) Besides the full-length α-PheRS isoform (55kDa), one stable Myc-tag containing isoform around 40 KDa and another around 25KDa appear when expressing transgenic Myc::α-PheRS under the control of the Tub-Gal4 driver (w; +/+; Tub-Gal4/UAS-Myc::α-PheRS). The 40 KDa isoform was present in larval heads and fat bodies, while the 25 KDa isoform was predominantly expressed in larval guts.

