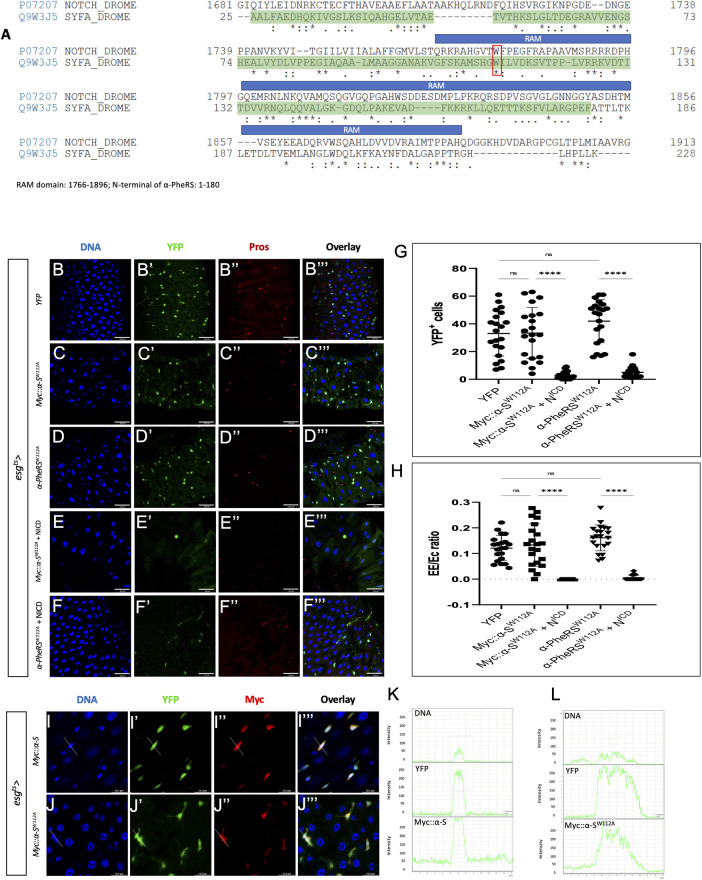
Fig 7. Possible mechanism of the competition between NICD and the α-S activity.
(A) The alignment of Notch and α-PheRS shows that moderately conserved motives are present in the RAM domain (1766–1896 aa) and the N-terminal sequence of α-PheRS (1–180 aa). The DNA binding domain (DBD) is shown shaded in green. The alignment task was conducted by the Alignment Tool of the Uniprot website (https://www.uniprot.org/) with two FASTA polypeptide sequences of Drosophila Notch and Drosophila α-PheRS. * (asterisk) indicates positions that have a single, fully conserved residue. “:” (colon) indicates conservation between groups of strongly similar properties—scoring > 0.5 in the Gonnet PAM 250 matrix. A “.” (period) indicates conservation between groups of weakly similar properties—scoring = < 0.5 in the Gonnet PAM 250 matrix. (B-D”’) Elevated YFP (control), Myc::α-SW112A or α-PheRSW112A levels induced by the esgts system (see Fig 1E for details) did not lead to additional YFP-positive cells and also not to the hyper-accumulation of EEs. (E- F”’) Neither elevated Myc::α-SW112A nor α-PheRSW112A levels rescued the depleted ISC pool caused by Notch over-activation (induced by expressing the NICD under the same control). Note that F shows only 2 Pros+ cells, the weaker signals are caused by autofluorescence from some fibers. (G) Quantification of YFP+ cell numbers and (H) Proportional contribution of EEs to the total number of gut cells in the intestinal region analyzed (visualized with the 63x objective and Leica SP8). Animals were mated at 18°C, and adults of the required genotypes were collected and shifted to 29°C to inactivate Gal80ts. Adult midguts were dissected from female flies after 5 days of induction at 29°C. At least 10 guts were analyzed for each genotype. n = 10, **p<0.01, ***p<0.001, ****p<0.0001 in ANOVA tests. (I-J”’) The anti Myc staining revealed the presence of both Myc::α-S and Myc::α-SW112A in nuclei. Signal intensity values in the graphs (L) and (K) were measured from left to right along the lines in I”’ and J”’, respectively.

