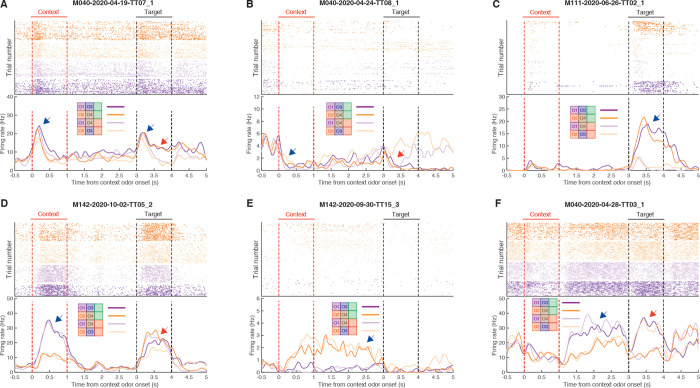
Fig 2. Example single-unit responses for units with outcome- (top) and context-related (bottom) correlates.
Top of each plot shows spike rasters for the 4 trial types (purple: trials with context cue O1; orange: trials with context cue O2; dark colors: rewarded trials; light colors: unrewarded trials). Bottom half of each panel shows trial-averaged firing rates for each trial type aligned to context cue onset. Context cue presentation (0–1 s) is bordered by red lines, and target cue presentation (3–4 s) is bordered by black lines. (A) Example unit that shows a general response to cue presentation (blue arrow), as well as a subsequent discrimination between rewarded and unrewarded trials after target cue onset (red arrow). (B) Example unit showing a dip in firing after context cue onset (blue arrow), followed by a ramping of activity leading up to target cue onset, and a subsequent dip in firing after presentation of the rewarded target cue (red arrow). (C) Example unit that predominantly responds during presentation of the rewarded target cue (blue arrow). (D) Example unit that shows transient responses to the cues, showing a discrimination to both context (blue arrow) and target (red arrow) cues. (E) Example unit that discriminates between context cues, including throughout the delay period (blue arrow). (F) Example unit that discriminates context cues only during the delay period following offset of the context cue (blue arrow), as well as discriminating the subsequent target cues (red arrow). Data: https://gin.g-node.org/jgmaz/BiconditionalOdor.

