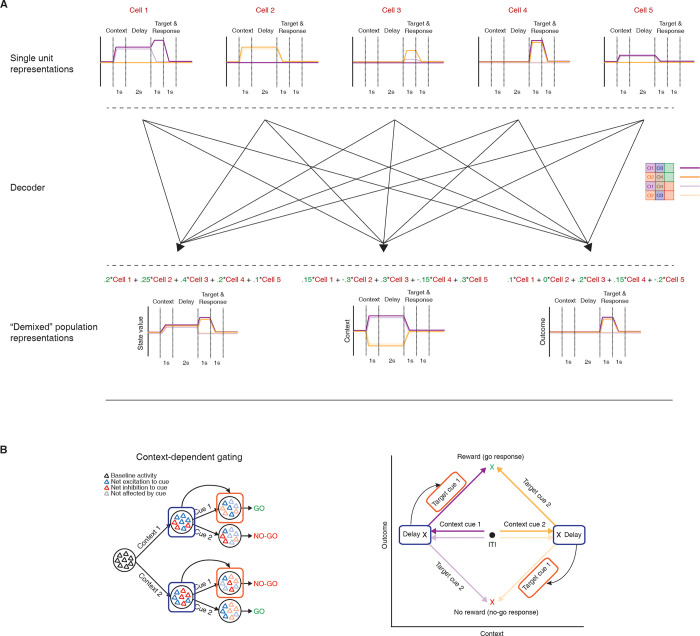
Fig 6. Schematic of workflow for population-level analyses.
(A) To investigate population-level representations of task features, and their relationship to one another, requires a dimensionality reduction technique that can extract latent variables representing individual features of the task, while preserving the structure of the data. In dPCA, pseudo-ensemble activity for each mouse, shown here by 5 hypothetical single-unit response profiles (top), can be reduced into a few key behaviorally relevant components (bottom) through a decoder (middle) that seeks to minimize reconstruction error between reconstructed data and task-specific trial-averaged data. Note, there are multiple ways to combine individual units to generate population-level representations. In this example, orthogonal context- and outcome-related representations are extracted, suggesting that these 2 patterns of activity occupy separate subspaces in the neural activity space. Green numbers represent the weights of a unit for a given component. (B) The hypothetical context- and outcome-related components (right) can be used to test the feasibility of the context-dependent gating hypothesis (left). Shown on the bottom is the progression of neural activity through a trial for each trial type in a two-dimensional neural subspace, with the trial-averaged projected activity in the context-related component on the x-axis, and the trial-averaged projected activity in the outcome-related component on the y-axis. If the context-related component brings the network to a distinct state (note the separation along the context-axis from ITI to delay) that modulates the input–output mapping of the subsequent target cue (note the separate paths taken by a target cue in the neural space for each context cue), then a quantifiable relationship should exist between the 2 components at these time points. This can be tested by using linear regression to predict activity (arrow) in the value axis during target cue presentation (red box) from activity in a context axis during the delay period preceding target cue presentation (blue box). dPCA, demixed principal component analysis; ITI, intertrial interval.

