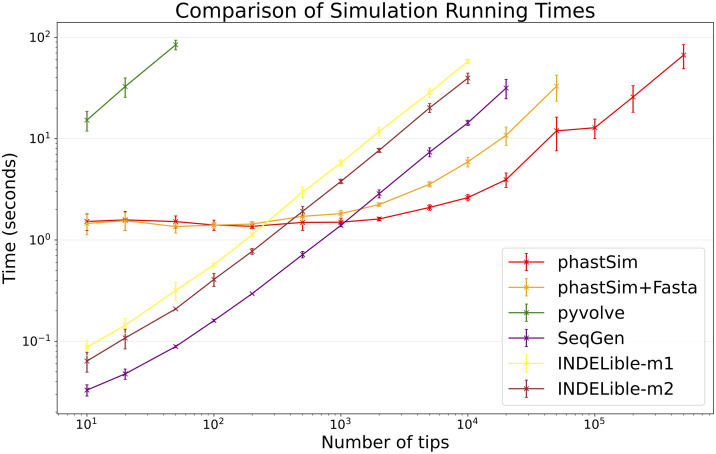
Fig 3. Comparison of running times of different simulators in a scenario similar to SARS-CoV-2 data.
On the Y axis we show the number of seconds it takes to perform simulations using different software. On the X axis is the number of tips simulated. Each point represents ten replicates. We do not run the most demanding simulators when each replicate would take substantially more than 1 minute to run. In red is the time to run phastSim with a concise output, and in orange is the time for phastSim with additionally generating a FASTA format output. In green is the demand of pyvolve, and in purple of Seq-Gen. In yellow and brown are respectively the time for running INDELible with method 1 (matrix exponentiation) and method 2 (Gillespie approach).

