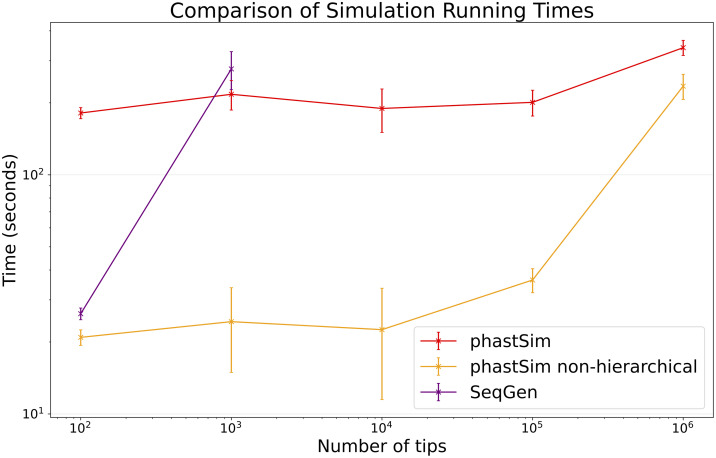
Fig 4. Comparison of running times of different simulators in a scenario similar to E. Coli outbreak data.
On the Y axis we show the number of seconds it takes to perform simulations using different software. On the X axis is the number of tips simulated. Each point represents ten replicates. We do not run Seq-Gen for more than 1000 tips due to high computational demand. In red is the time to run phastSim, and in orange is the time for phastSim with the simple, non-hierarchical approach. In purple is the time demand of Seq-Gen.

