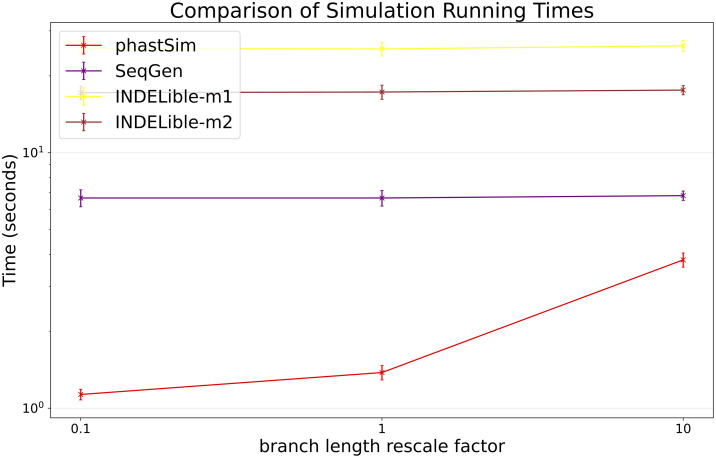
Fig 7. Comparison of running times of different simulators in a SARS-CoV-2 scenario after rescaling the tree branch lengths by different factors.
On the Y axis we show the number of seconds it takes to perform simulations using different software. On the X axis is the rescaling factor we use to make the phylogenetic tree branch lengths longer or shorter. Colors are as in Fig 3. Here we used alignments of 5000 tips.

