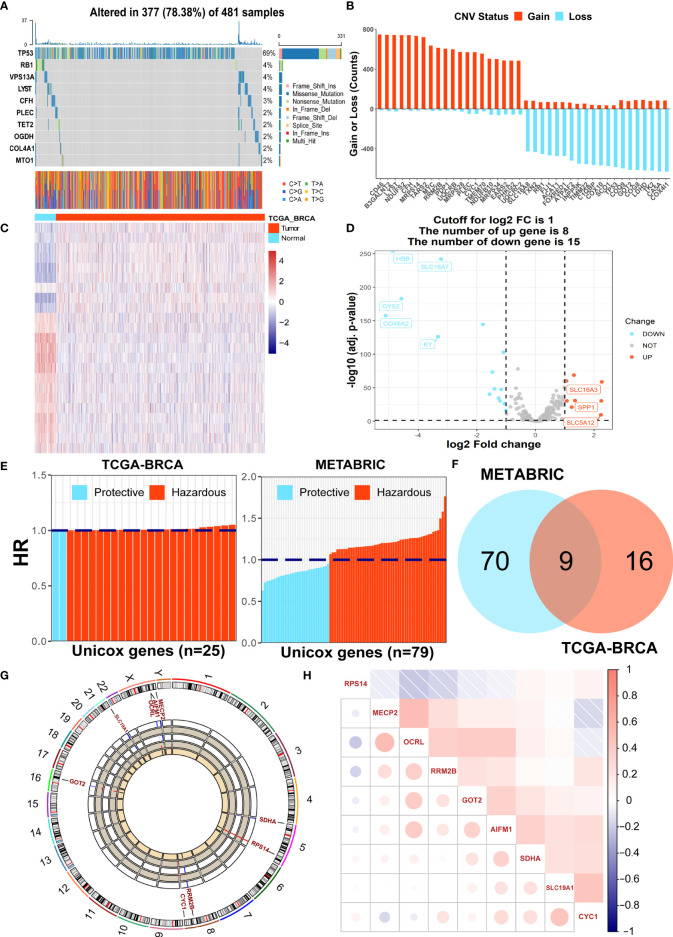
Figure 1.
Identification of prognostic LMGs in BC patients. (A) The somatic mutation frequency of LMGs in the TCGA-BRCA cohort. (B) The prevalent CNV frequency of LMGs in the TCGA-BRCA cohort. (C) Heatmap of differentially expressed genes among LMGs. (D) Volcano plot exhibiting DEGs in LMGs. (E) OS-related LMGs in TCGA-BRCA and METABRIC datasets, respectively. (F) The Veen diagram to detect 9 common prognostic LMGs. (G) The Circos plot illustrating the locations on chromosomes and expression levels of the 9 candidate LMGs. (H) The correlation matrix plot containing 9 prognostic LMGs.

