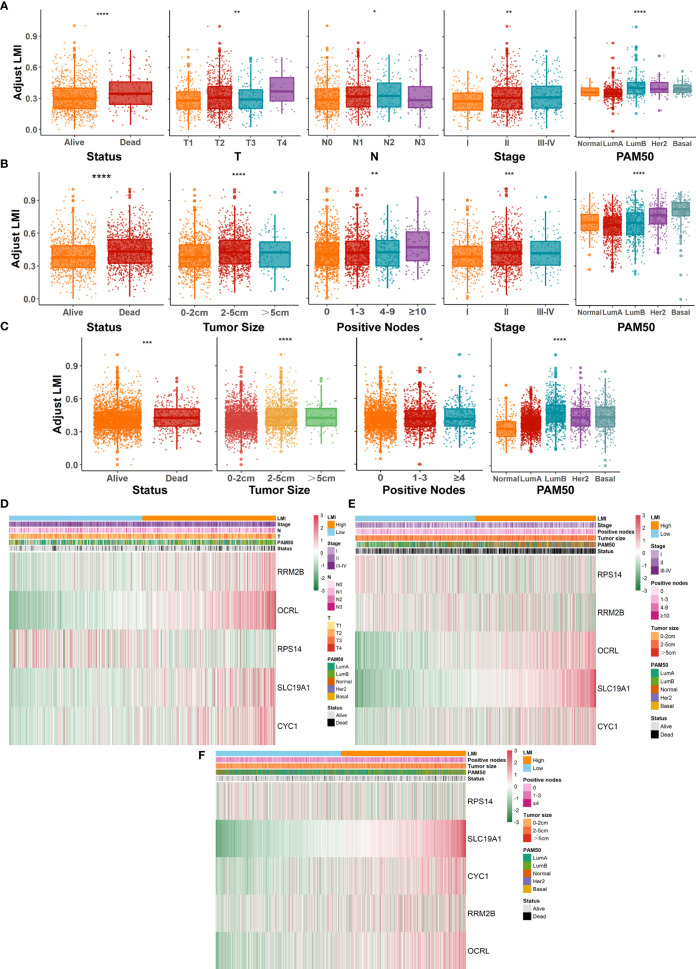
Figure 4.
Systematic dissection of LMI and clinical parameters in BC patients. The boxplots to illustrate the correlation between LMI and different clinicopathological characteristics of BC patients in TCGA-BRCA (A), METABRIC (B) and GSE96058 (C), respectively. Correlation heatmaps of signature-included LMGs and clinicopathological features in datasets of TCGA-BRCA (D), METABRIC (E) and GSE96058 (F) separately. *p < 0.05; **p < 0.01; ***p < 0.001; ****p < 0.0001.

