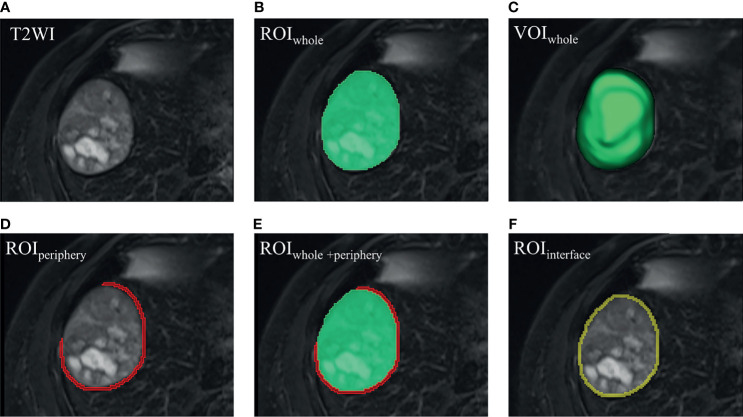
Figure 3.
Visualized segmentation images. (A) HCC lesion in T2WI. (B) ROIwhole (green) was manually delineated slice by slice. (C) VOIwhole (green) was automatically constructed, covering the whole tumor. (D) On the bases of VOIwhole, VOIperiphery was made hollow by replacing VOIwhole with a peritumoral 5-mm-thickness zone, and the covering part was erased when encountering liver margin, gall bladder, or large vessels (like the inferior vena cava). (E) VOIwhole + periphery was generated from the combination of VOIwhole and VOIperiphery. (F) VOIinterface (yellow) was made by volume of 2-pixel automated dilation based on VOIwhole subtracting volume of 2-pixel shrinkage based on VOIwhole, termed the liver–tumor interface. Please note that one pixel is around 1.2 mm, and then 4-pixel-wide band is approximately 5 mm. (D–F) 2-dimensional view of the VOIperiphery, VOIwhole + periphery and VOIinterface, respectively. ROI, region of interest. VOI, volume of interest.

