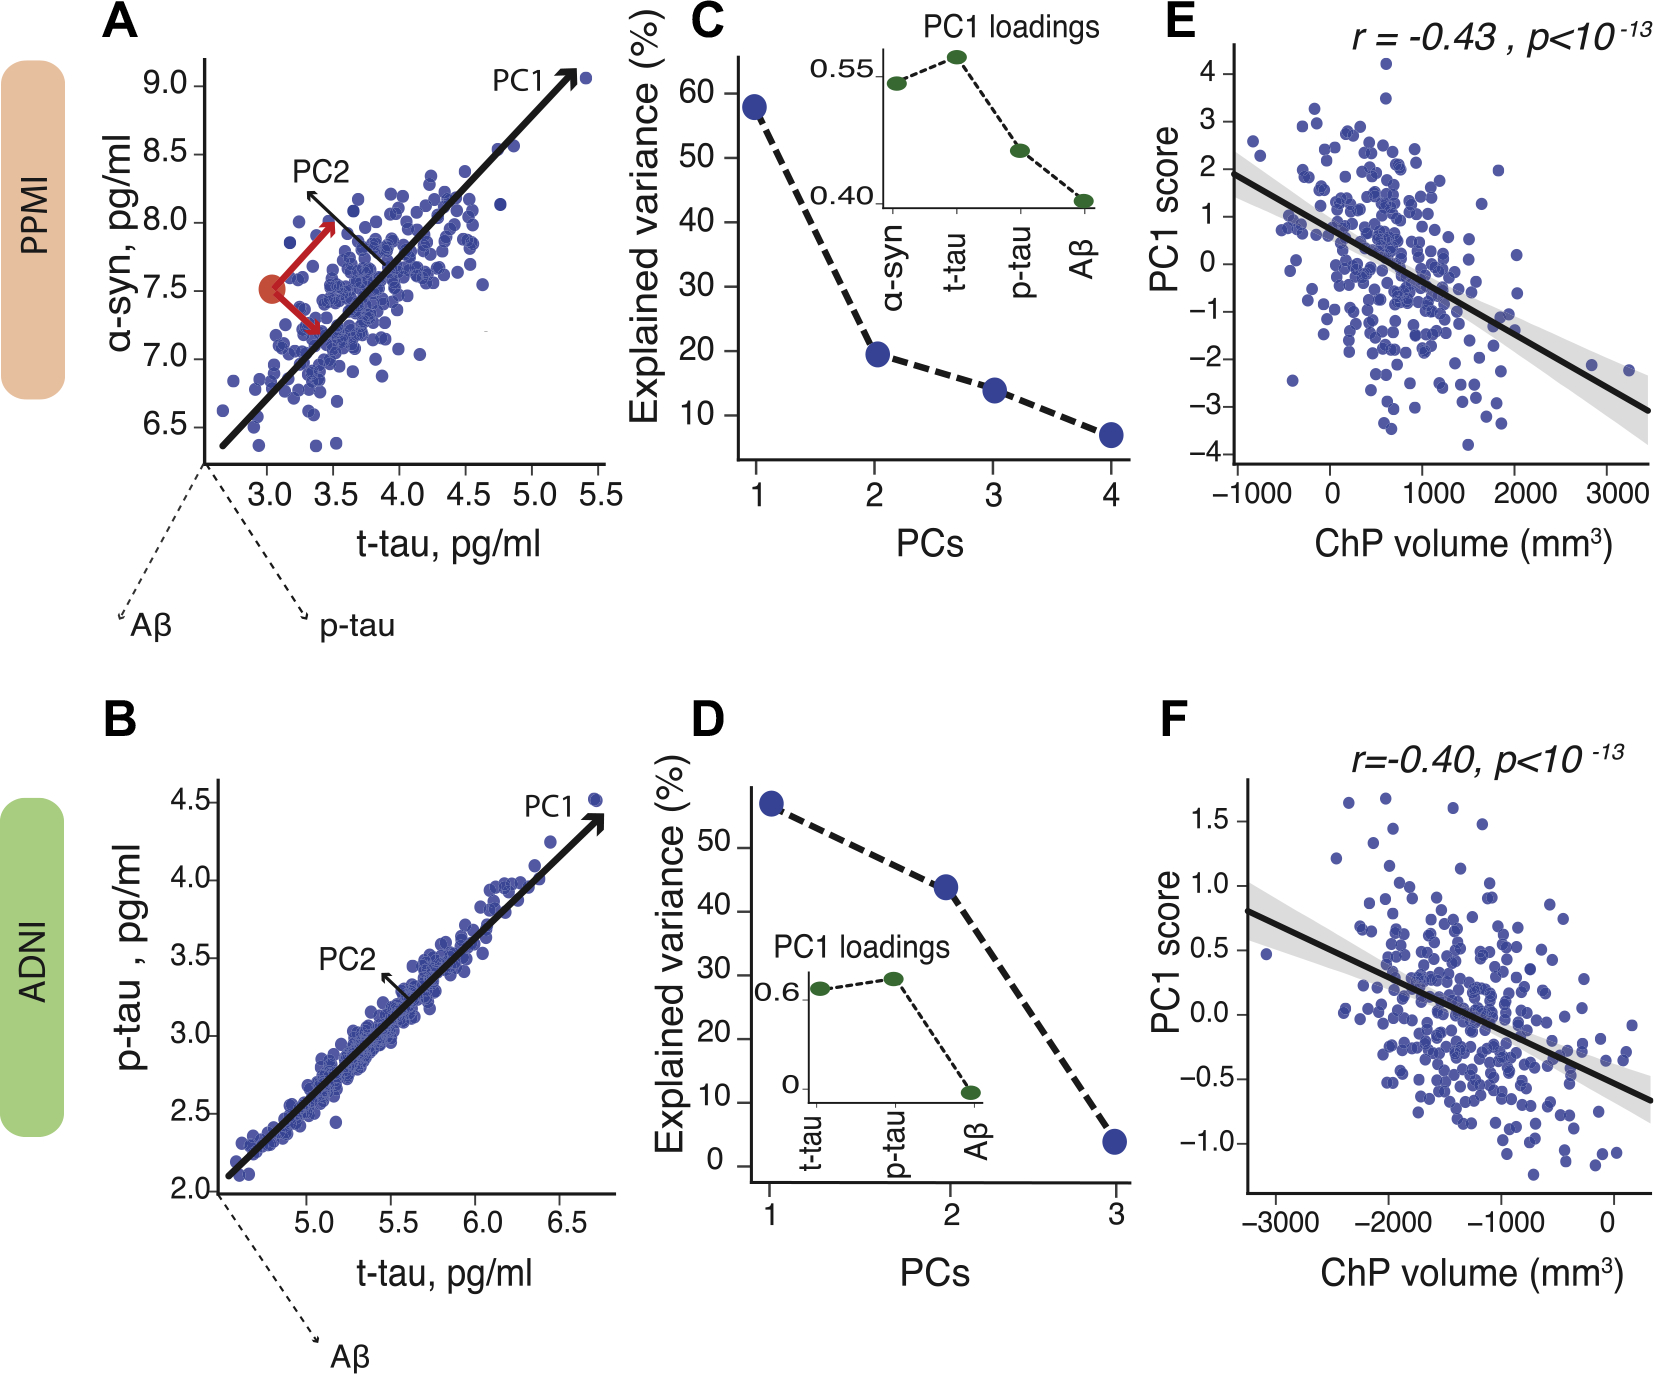
Fig. 2.

Principal component analysis (PCA) of CSF proteins. To capture the highest amount of variance in CSF proteins, we applied principal component analysis in PPMI (A) and ADNI-2 (D). PCA score is computed by projecting each data point coordinate (red dot) onto the corresponding principal components (red lines) (left plots; for illustration purposes only 2 CSF proteins are shown). The first principal component (PC1) explains around 60 percent of variance in CSF proteins in PPMI (B) and ADNI-2 (E). The insets show the loadings of PC1. The scatter plots show partial correlation between ChP volume and PC1, after correcting for age, sex, APOEε4 status, group, and cortical volume in PPMI (C) and ADNI (F). Note: levels of CSF proteins are log-tranformed. Abbreviations: ADNI, Alzheimer’s Disease Neuroimaging Initiative; ChP, choroid plexus; PC, principal component; PPMI, Parkinson’s Progression Markers Initiative. (For interpretation of the references to color in this figure legend, the reader is referred to the Web version of this article.)
