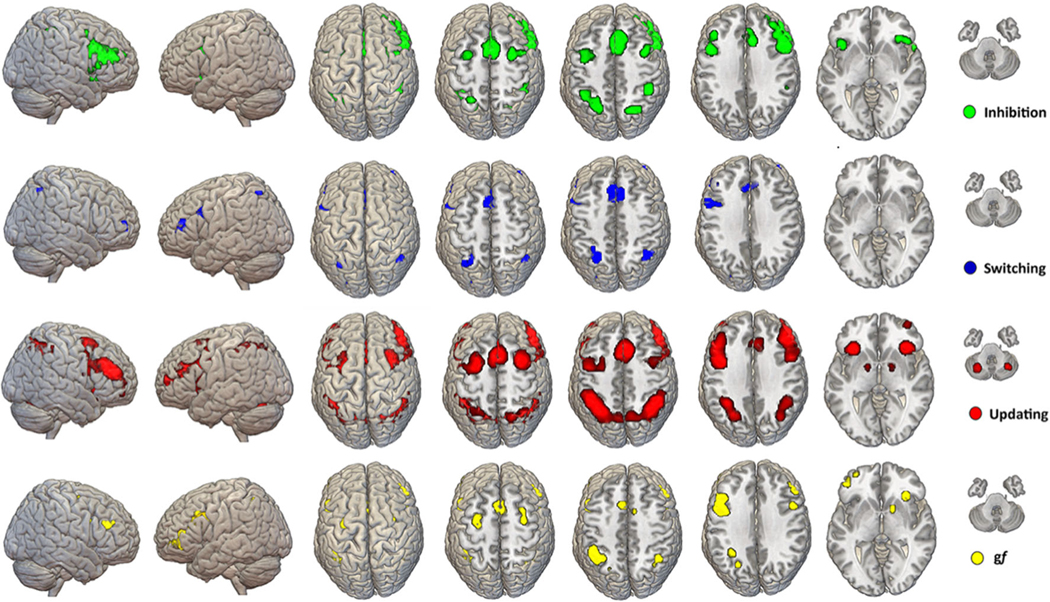
Fig. 1.
ALE maps. Results of the quantitative analysis of fMRI activation for gf and EFs tasks are shown on a template brain in MNI space. The maps are the results of voxel-wise analysis based on p < 0.001 threshold for cluster-formation and a p < 0.05 for cluster-level inference. On average, clusters had a dimension between 500–1,000 mm3. Amore comprehensive depiction of each EF map is available as part of the supplementary materials of the manuscript (Figures S1-2-3; Tables S2-3-4). Note: MNI = Montreal Neurologic Institute

