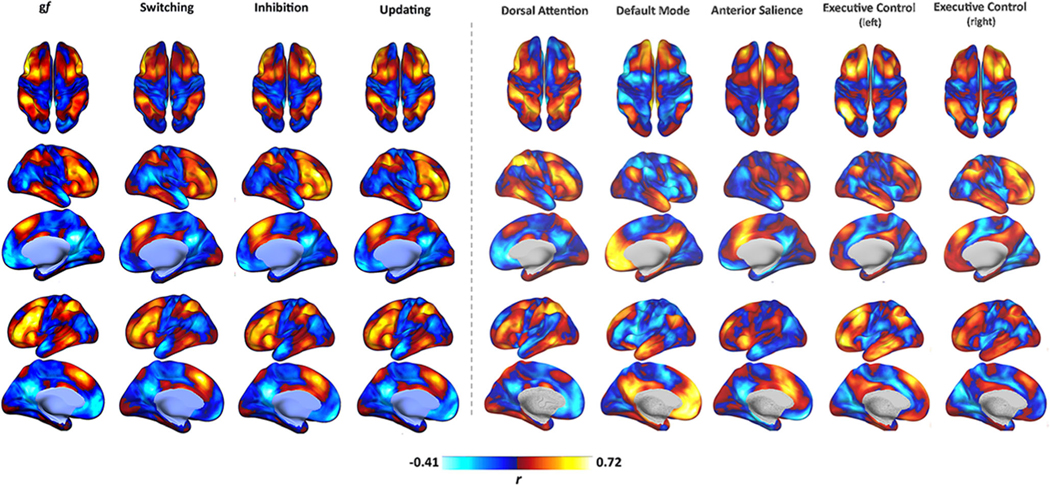
Fig. 5.
Functional connectivity profile. As visible, gf and EFs maps display high similarity in terms of their functional connectivity fMRI profile, with a strong positive connectivity between their nodes and a negative connectivity with brain regions resembling the DMN. Their overall pattern also seems to resemble those of other “cognitive” RSNs, such as the FPCN and DAN. Connectivity is expressed as correlation coefficient between the average BOLD signal extracted from each map and that of any other voxel in the brain. Data refer to the FAST dataset. DMN = Default Mode Network.

