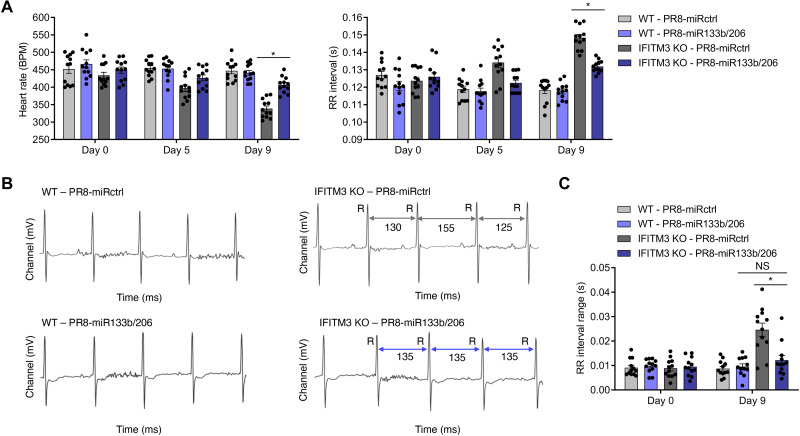
Fig. 6. Virus replication in the heart drives cardiac dysfunction during infection.
WT and IFITM3 KO mice were intranasally infected with PR8-miR133b/206 or PR8-miRctrl (50 TCID50). (A) ECG measurements over the time course of infection. Data were collected over at least three independent experiments. Each point represents an individual mouse, and bars represent mean values. Error bars represent SD of the mean. Comparisons were analyzed by ANOVA followed by Tukey’s post hoc test. *P < 0.05. (B) Example ECG readings from each genotype-virus combination. Selected RR intervals of the infected KO mice are highlighted by gray (PR8-miRctrl) or purple (PR8-miR133b/206) double arrows. (C) RR interval ranges, defined as the difference between the longest and shortest RR intervals over an ECG measurement period of 5 min, were calculated for individual mice on day 9 after infection. Each point represents an individual mouse, and bars represent mean values. Error bars represent SD of the mean. Comparisons were analyzed by ANOVA followed by Tukey’s post hoc test. *P < 0.05. BPM, beats per minute.

