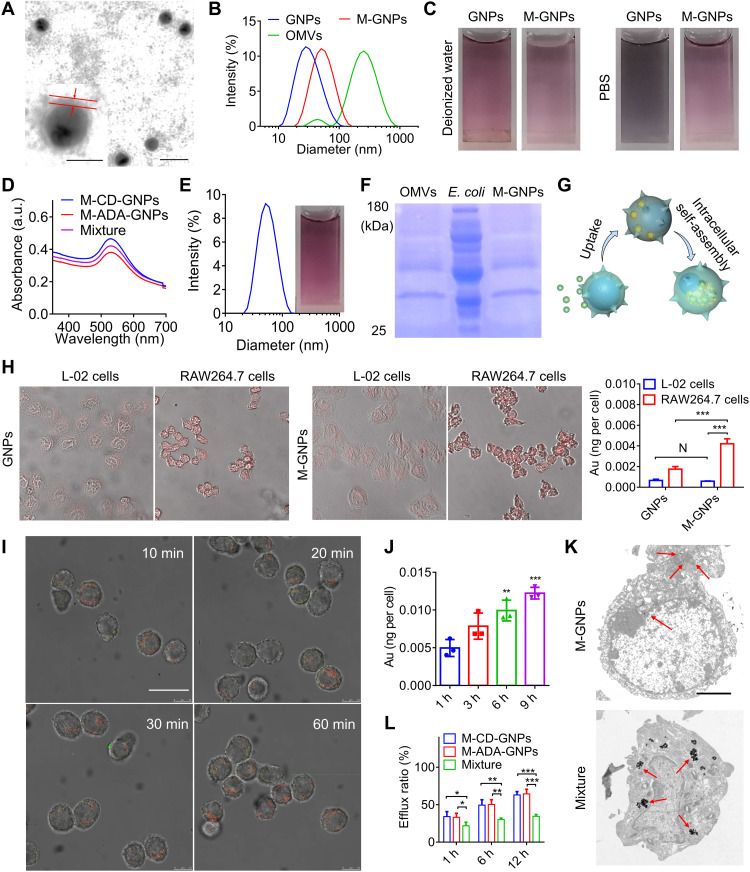
Fig. 3. Selective phagocytosis and intracellular self-assembly of M-GNPs in macrophage.
(A) TEM image of M-GNPs. Scale bar, 50 nm. Insert: Amplified M-GNPs (scale bar, 20 nm). (B) Size distribution of GNPs, M-GNPs, and OMVs. (C) Photographs of GNPs and M-GNPs in deionized water or PBS. (D) UV-vis absorption spectrum of Mixture. (E) Size distribution and photograph of Mixture. (F) The protein bands of M-GNPs, OMVs, and E. coli in the gel by Coomassie Blue staining. (G) Scheme showing selective intracellular uptake and self-assembly of M-GNP Mixture. (H) Fluorescence imaging on the intracellular uptake of GNPs and M-GNPs by L-02 cells and RAW264.7 cells, respectively, and the quantitative analysis on the intracellular Au content by ICP-MS. (I) RAW264.7 cells were incubated with the mixture of M– fluorescein isothiocyanate (FITC)–ADA-GNPs and M-Cy5-CD-GNPs for different durations (10, 20, 30, and 60 min), and CLSM imaging was conducted at 9 hours. Scale bar, 20 μm. (J) Intracellular Au content in RAW264.7 cells was analyzed via ICP-MS, after incubation with the mixture of M-FITC-ADA-GNPs and M-Cy5-CD-GNPs for 3, 6, and 9 hours. (K) TEM imaging on Mixture- and M-GNP–treated RAW264.7 cells, respectively. Scale bar, 2.5 μm. (L) After treatment with the mixture of M-FITC-ADA-GNPs and M-Cy5-CD-GNPs for 6 hours, RAW264.7 cells were incubated in fresh media for different durations (1, 6, and 12 hours) and quantified by ICP-MS at all preset time points. The experiments were repeated three times (n = 3) and data were presented as means ± SD. Statistical analysis for (I) and (L) were performed using two-way ANOVA. All other analyses were conducted using one-way ANOVA. *P ≤ 0.05, **P ≤ 0.01, and ***P ≤ 0.001.

