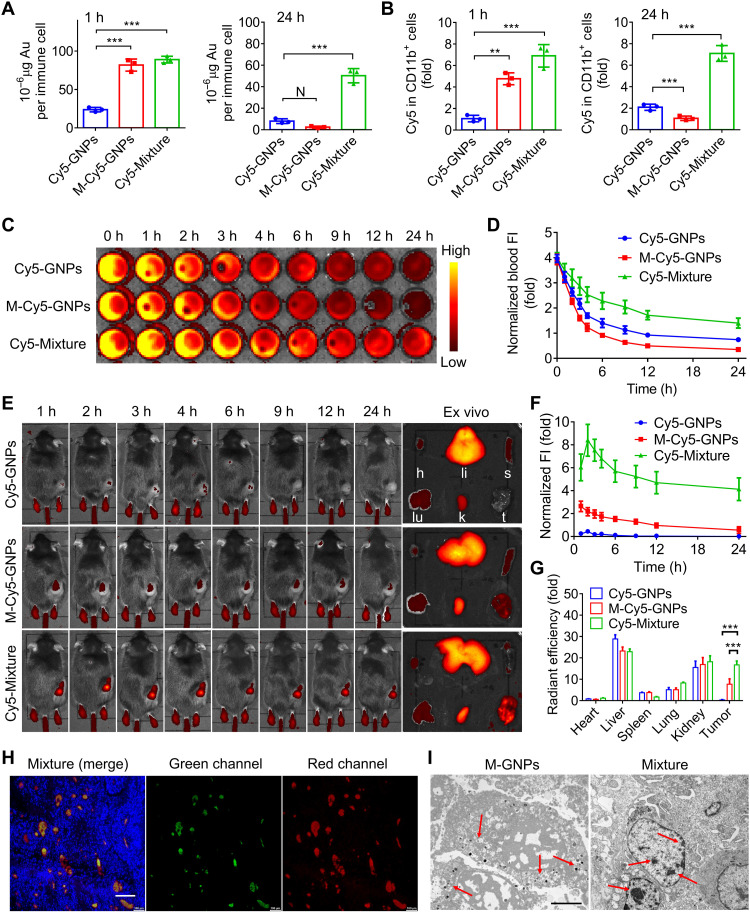
Fig. 5. In vivo construction of immune cell–based nanomedicine carriers and increased hitchhiking delivery to the tumors.
(A and B) Melanoma mice were treated with Cy5-GNPs, M-Cy5-GNPs, and Cy5-Mixture at the Cy5 dose of 0.5 mg/kg for 24 hours, and the quantitative analysis of Au content (A) and Cy5 fluorescence (B) was conducted in the collected immune cells at 1 and 24 hours after administration, by using ICP-MS and flow cytometry, respectively. h, hour or hours. (C and D) Fluorescence imaging of the blood (C) collected from Cy5-Mixture–treated mice at different time points (1, 2, 3, 4, 6, 9, 12, and 24 hours) and the corresponding fluorescence intensity (FI)–time curves (D). (E to G) In vivo fluorescence images (E) and intensity-time curves (F) of Cy5-Mixture–treated mice at different time points (1, 2, 3, 4, 6, 9, 12, and 24 hours) and ex vivo imaging (E) and quantified radiant efficiency (G) on the heart (h), liver (li), spleen (s), lung (lu), kidney (k), and tumor (t) collected from melanoma mice after administration for 24 hours. (H) Fluorescent section analysis on the tumor collected from mice treated with the mixture of FITC-labeled M-ADA-GNPs and Cy5-labeled M-CD-GNPs for 24 hours. Green, FITC-labeled ADA-GNPs; red: Cy5-labeled CD-GNPs. Scale bar, 200 μm. (I) TEM analysis of GNP aggregates and GNPs in the collected tumor tissues after administration for 24 hours. Scale bar, 3 μm. The experiments were repeated three times (n = 3) and data were presented as means ± SD. Statistical analysis for (G) was performed using two-way ANOVA. All other analyses were conducted using one-way ANOVA. **P ≤ 0.01 and ***P ≤ 0.001.

