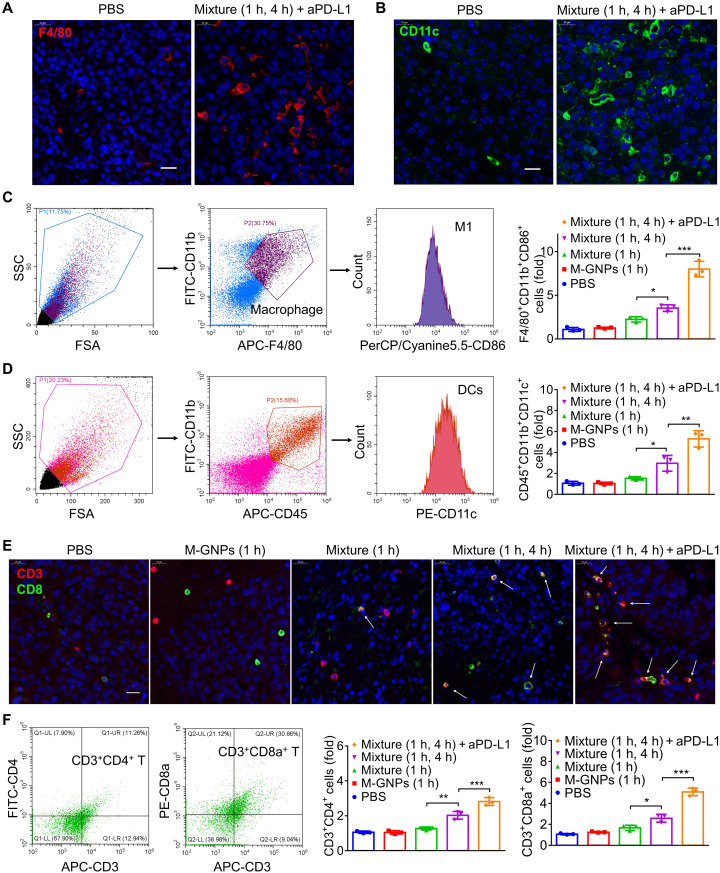
Fig. 8. Enhanced intratumoral infiltration of immune cells by PTT treatment induced ICD with or without aPD-L1.
(A and B) Immunofluorescence analysis on the infiltration of F4/80+ cells (A) and CD11c+ cells (B) in the tumor tissues collected from mice after administration for 7 days. (C and D) Flow cytometry analysis on M1 macrophages (F4/80+CD11b+CD86+ cells) (C) and DCs (CD45+CD11b+CD11c+ cells) (D) in the tumor tissues collected on day 7. (E) Immunofluorescence analysis on the infiltration of CD3+CD8+ cells into the tumor tissues collected from mice after administration for 7 days. (F) Flow cytometry analysis of CD4+ T cells (CD3+CD4+ cells) and CD8+ T cells (CD3+CD8a+ cells) in the tumor tissues collected on day 7. The experiments were repeated three times (n = 3) and data were presented as means ± SD. All statistical analyses were performed using one-way ANOVA. *P ≤ 0.05, **P ≤ 0.01, and ***P ≤ 0.001.

