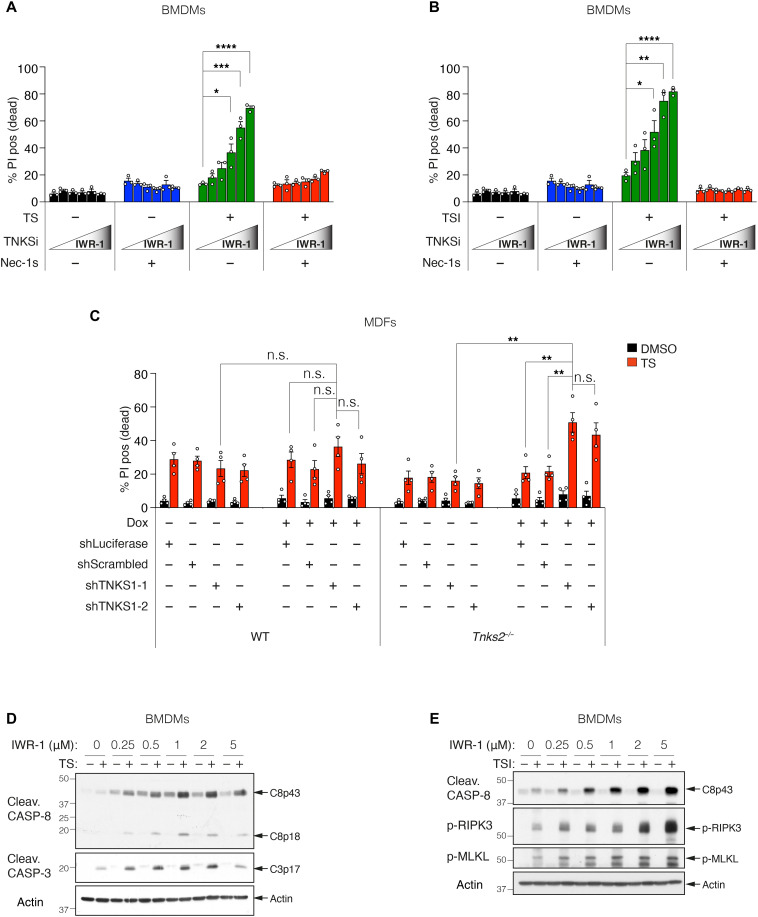
Fig. 3. Tankyrases protect from TNF-induced cell death.
(A and B) Level of cell death assessed by PI-positive cells. WT BMDMs were treated with TNF (10 ng/ml) + Smac-mimetic (500 nM; TS) for 24 hours (A) or TNF (10 ng/ml) + Smac mimetic (10 nM) + caspase inhibitor (5 μM; TSI) for 16 hours (B) ± IWR-1 (250 and 500 nM and 1, 2, and 5 μM) ± Nec-1 s (10 μM). Graph shows means ± SEM, n = 3 independent BMDMs. (C) Level of cell death assessed by PI-positive cells. WT MDFs or Tnks2−/− MDFs expressing Dox-inducible shRNA were pretreated with ± Dox (1 μg/ml) for 48 hours followed by TNF (50 ng/ml) + Smac mimetic (10 nM; TS) ± Dox (1 μg/ml) for 17 hours. Cell death was quantified by PI uptake using time-lapse imaging (IncuCyte). Percent (%) PI positive (dead) at 17 hours TS treatment was plotted to generate bar graph. Graph shows means ± SEM, n = 4 independent experiments using two independent MDFs. IncuCyte data are shown in fig. S3C. (D and E) Western blot analysis of cell lysates from WT BMDMs using indicated antibodies is shown. Cells were treated with TNF (10 ng/ml) + Smac mimetic (500 nM; TS) (D) or TNF (10 ng/ml) + Smac mimetic (20 nM) + caspase inhibitor (5 μM; TSI) (E) ± IWR-1 (250 and 500 nM and 1, 2, and 5 μM) for 8 hours. Comparisons were performed with a Student’s t test whose values are denoted as *P ≤ 0.05, **P ≤ 0.01, ***P ≤ 0.001, and ****P ≤ 0.0001; n.s., no significance.

