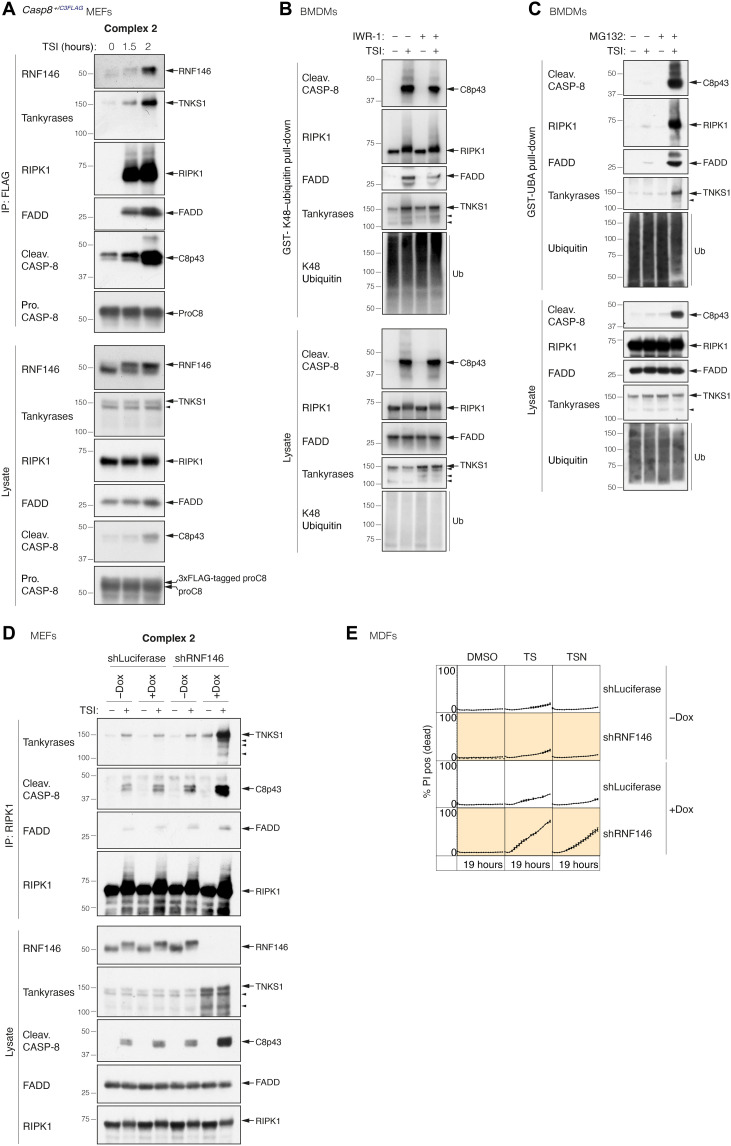
Fig. 5. The tankyrase-RNF146 axis regulates the stability of complex 2 and TNF-induced death.
(A) TNF-induced complex 2 immunoprecipitation using anti-FLAG M2 affinity beads. Casp8+/C3FLAG MEFs were treated with TNF (100 ng/ml) + Smac mimetic (500 nM) + caspase inhibitor (5 μM; TSI) for the indicated time points. (B) GST-K48–ubiquitin pull-down of stimulated WT BMDM lysates. Cells were treated with TSI [as in (A)] for 1.5 hours ± IWR-1 (5 μM). (C) GST-UBA pull-down of stimulated WT BMDMs lysates. Cells were pretreated with ± proteasome inhibitor MG132 (10 μM) for 2 hours, followed by TNF (10 ng/ml) + Smac mimetic (50 nM) + caspase inhibitor (5 μM; TSI) ± MG132 (10 μM) for another 2 hours. (D) TNF-induced complex 2 immunoprecipitation using anti-RIPK1 antibody. WT MEFs expressing GFP-tagged Dox-inducible shLuciferase or shRNF146 were pretreated with ± Dox (1 μg/ml) for 48 hours. Cells were then treated with TSI [as in (A)] ± Dox (1 μg/ml) for another 2 hours. (E) Cell death monitored by time-lapse imaging (IncuCyte) of PI staining. WT MDFs expressing GFP-tagged Dox-inducible shLuciferase or shRNF146 were pretreated with ± Dox (1 μg/ml) for 48 hours, followed by TNF (50 ng/ml) + Smac mimetic (50 nM; TS) ± Dox (1 μg/ml) ± Nec-1 s (10 μM) for another 19 hours. % PI positive (dead) was obtained by normalizing PI count to GFP-positive cells. Graph shows means ± SEM. n = 3 independent MDFs. Filled arrowheads alone indicate potential tankyrase species. Double bands around 150 kDa in anti-tankyrase blots indicate full-length TNKS1 (upper band, 150 kDa) and an undefined TNKS1 isoform (lower band).

