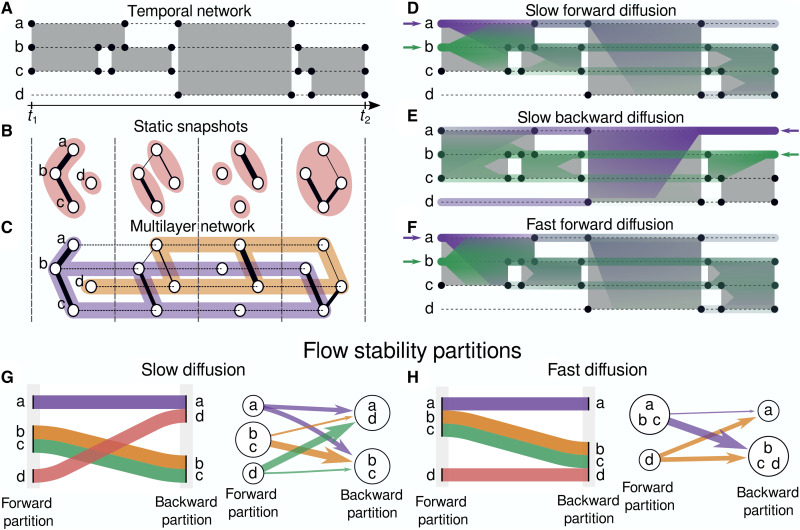
Fig. 1. Schematic representation of the flow stability compared to other temporal community detection methods.
(A) Example of a temporal network with four nodes (a, b, c, and d) and events joining pairs of nodes for different durations in continuous time. (B) A representation of the temporal network as four static networks each representing the aggregated edge activity over the corresponding time window. The communities found by modularity optimization are overlayed. (C) Multilayer representation of the sequence of static networks with interlayer links added in-between layers. The communities found by optimizing the multilayer modularity (6) (in orange and purple) extend over several layers. (D to F) Schematic representation of a diffusion process starting on nodes a (purple) and b (green) in forward time (D) and backward time (E). The probability density of the process at time t, computed with the transition probability matrix T(t1, t) for the forward time and Trev(t2, t) for the backward time, is represented by the transparency of the colors. Using a faster diffusion rate (F), the process explores larger areas faster, and earlier events become more important. The flow stability method groups nodes together on the basis of the similarity of the diffusion processes starting on them and takes into account the ordering of the events and the dynamics of the network. (G) Two representations of the forward and backward partitions found with the flow stability method: an alluvial diagram (left) showing how nodes move between communities and a graph (right) showing the communities as meta nodes and the transition probabilities of the RW process between them as directed edges. Even by varying the aggregation window length, the initial and final static partitions cannot fully reproduce the results of the flow stability (see table S1). (H) Using a faster diffusion rate, nodes a and b are clustered together in the forward partition.

