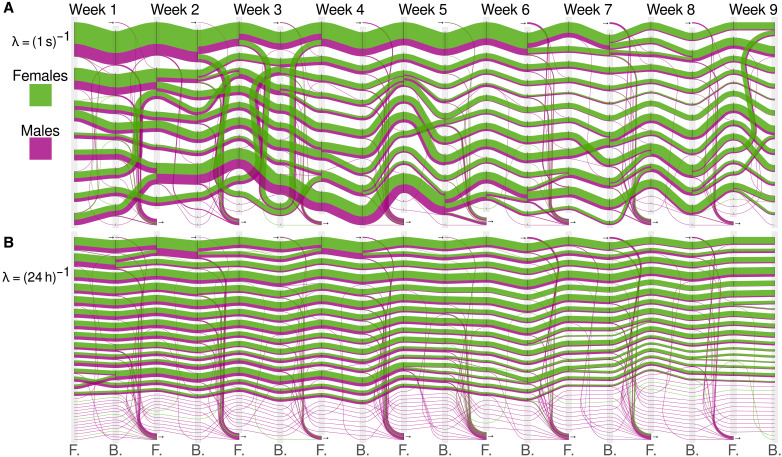
Fig. 6. Flow stability clustering of a contact network of free-ranging wild house mice.
(A and B) Alluvial diagram representing the forward and backward partitions at two different scales corresponding to RW rates of (1 s)−1 and (24 hours)−1, respectively. The flow corresponding to females is indicated in green, and the one corresponding to males is in purple. The community dynamics at a rate of (1 s)−1 (A) reveals the existence of large communities during the first weeks corresponding to the end of February and beginning of March, which split in smaller communities as spring arrives. At an RW rate of (24 hours)−1 (B), a finer description of the dynamics is revealed with the presence of smaller social groups with compositions and sizes that are very stable over the entire observation period.

