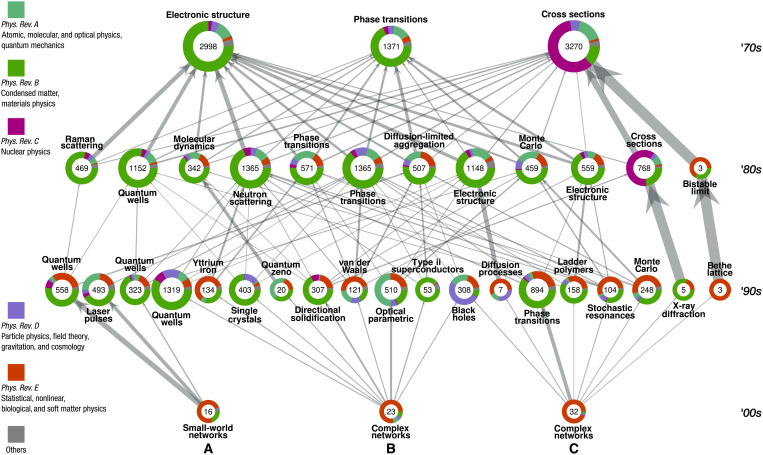
Fig. 9. Influential communities of authors of articles published in the APS journals for three communities of network scientists in the 2000s.
Each node represents a community, and its size is indicated in the center. The colors represent the distribution of journals inside each community where each author is associated to the journal in which they published the most (except large-scope journals). The pair of words next to each node indicate one of the most frequent pair of words of all the titles of the articles belonging to the community. Arrows between the communities represent probability transitions (>5%) from community to community of the diffusive process starting in 2010 and finishing in 1970.

