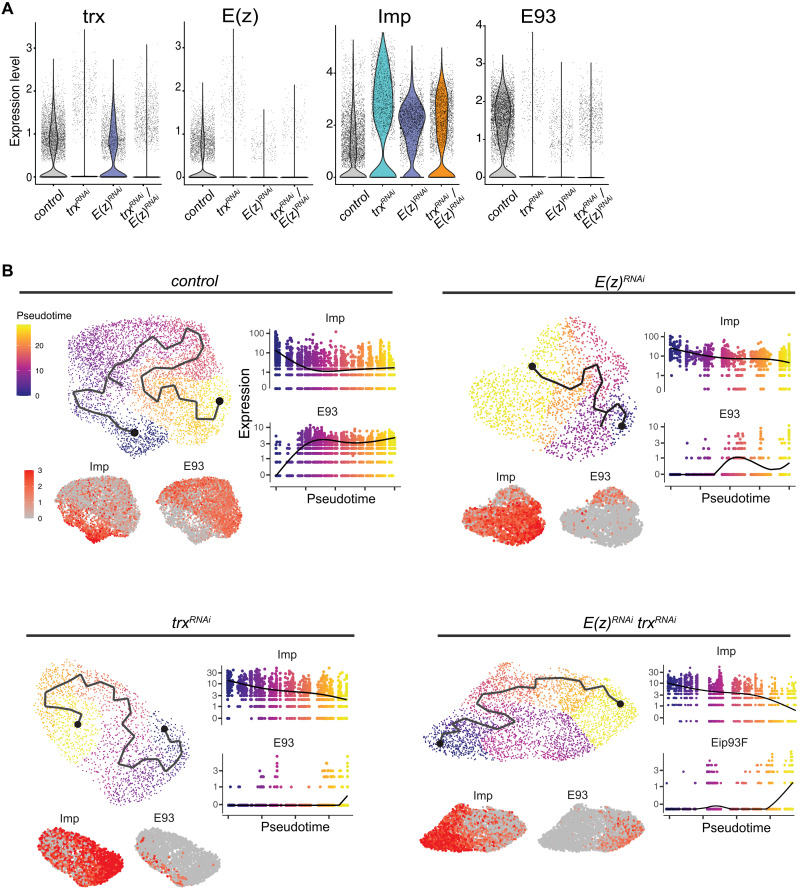
Fig. 4. Expression of Imp and E93 in tumors at the single-cell level.
(A) Violin plots depicting expression levels of representative genes under different tumor conditions from scRNA-seq data. (B) Trajectory and pseudotime analyses using tNBs for each tumor condition using Monocle 3. Imp and E93 are expressed in an anticorrelative manner along pseudotimes consistent with a common temporal patterning–mediated differentiation trajectory for all conditions.

