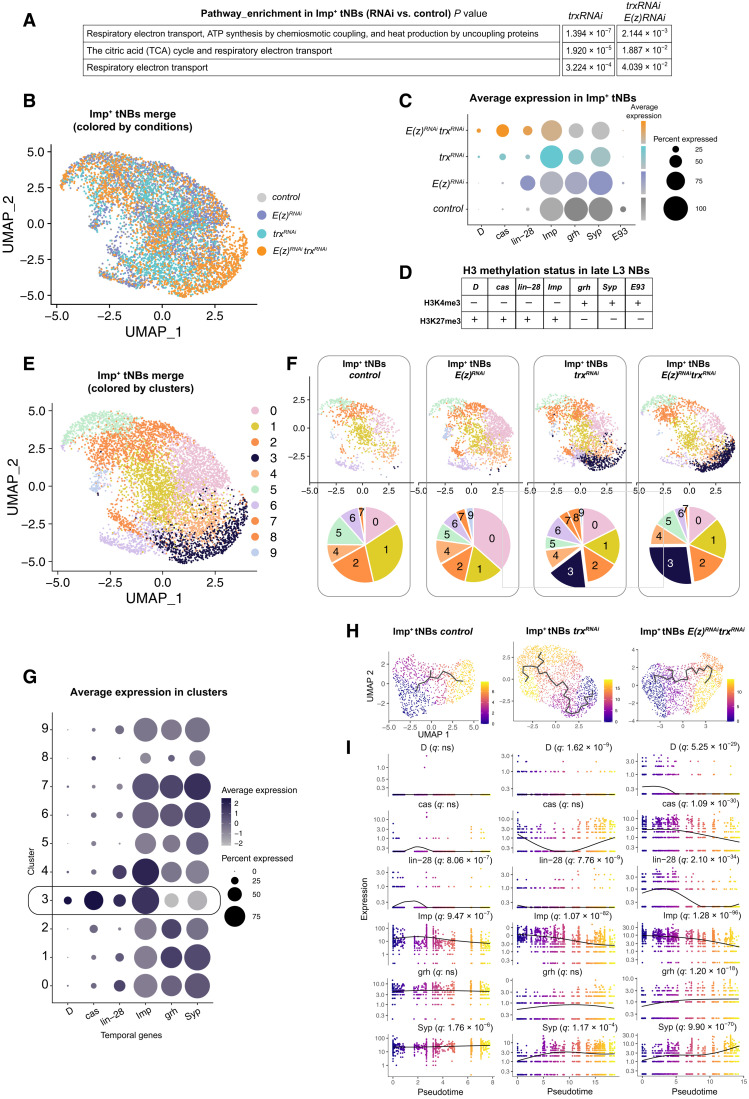
Fig. 6. Identification by scRNA-seq of an embryonic-like tNB subpopulation in tumors upon inactivation of trx.
(A) Pathway enrichment in the Imp+ tNB population of poxn>prosRNAi, trxRNAi and poxn>prosRNAi, E(z)RNAi, trxRNAi tumors compared to the Imp+ tNB population of control poxn>prosRNAi. (B) UMAP representation of the merged populations of Imp+ tNBs from the control and perturbed conditions. Dots are colored according to the genotype of tumors. (C) Dot plot depicting the average expression of temporal identity markers (from scRNA-seq data) in the Imp+ tNB population according to tumor genotype. (D) Summary of fig. S6 depicting the histone H3 methylation state in late L3 NBs. (E) UMAP representation of the merged populations of Imp+ tNBs from the control and perturbed conditions. Dots are colored according to clusters of transcriptional similarities. (F) Distribution of cells for each tumor genotype in the UMAP representation depicted in (E). Pie charts show the proportions of cells within each cluster for the depicted genotype. (G) Dot plot showing the average expression of temporal identity markers for the 10 clusters depicted in the UMAP representation in (E). Cluster 3 is enriched in embryonic temporal markers. (H) Inferred transcriptional trajectories (black line) within the population of Imp+ tNBs of the control, poxn>prosRNAi, trxRNAi, and poxn>prosRNAi, trxRNAi E(z)RNAi tumors. Dots are colored as a function of pseudotime. (I) Plots showing the dynamics of expression of temporal genes as a function of pseudotime for the three above conditions. q values represent adjusted false discovery rates, indicating that temporal genes significantly vary as a function of pseudotime.

