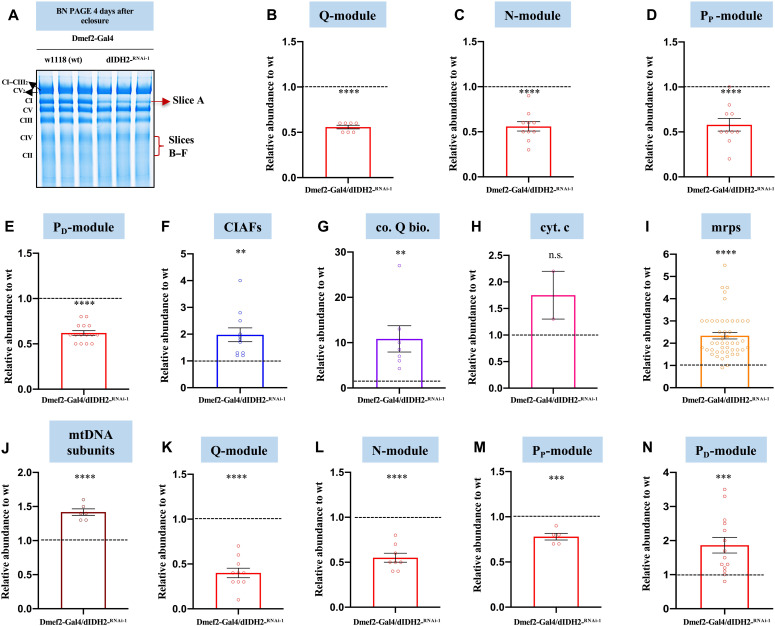
Fig. 6. A compensatory response is induced as a result of genetic disruption of dIDH2.
(A) BN-PAGE gel showing the gel slices that were excised and analyzed by mass spectrometry. (B to E) Label-free quantitative proteomics was used to assess the relative amount of CI subunits in the holoenzyme (gel slice A) that are part of the Q-module (B), N-module (C), PP-module (D), and PD-module (E) in mitochondrial preparations from Dmef2-Gal4/w1118 (wild-type) and dIDH2-KD1 fly thoraces. (F to J) Label-free quantitative proteomics was used to quantify the relative amount of CIAFs (F), genes that regulate coenzyme Q biosynthesis (co. Q bio.) (G), cytochrome c (cyt. c) (H), mitochondrial ribosomal proteins (mrps) (I), and mtDNA-encoded OXPHOS subunits (J), which comigrate with the holoenzyme in mitochondrial preparations from Dmef2-Gal4/w1118 (wild-type) and dIDH2-KD1 fly thoraces. (K to N) Label-free quantitative proteomics was used to assess the relative amount of CI subunits in gel slice B (overlaps with CIV) that are part of the Q-module (K), N-module (L), PP-module (M), and PD-module (N). In all six gel slices, n = 2 biological replicates with mitochondria from 20 fly thoraces per replicate; P values are based on Student’s t test for unpaired two-tailed samples. The fold change shown refers to the mean ± SEM, and n.s. denotes P > 0.05; **P < 0.01, ***P < 0.001, and ****P < 0.0001.

