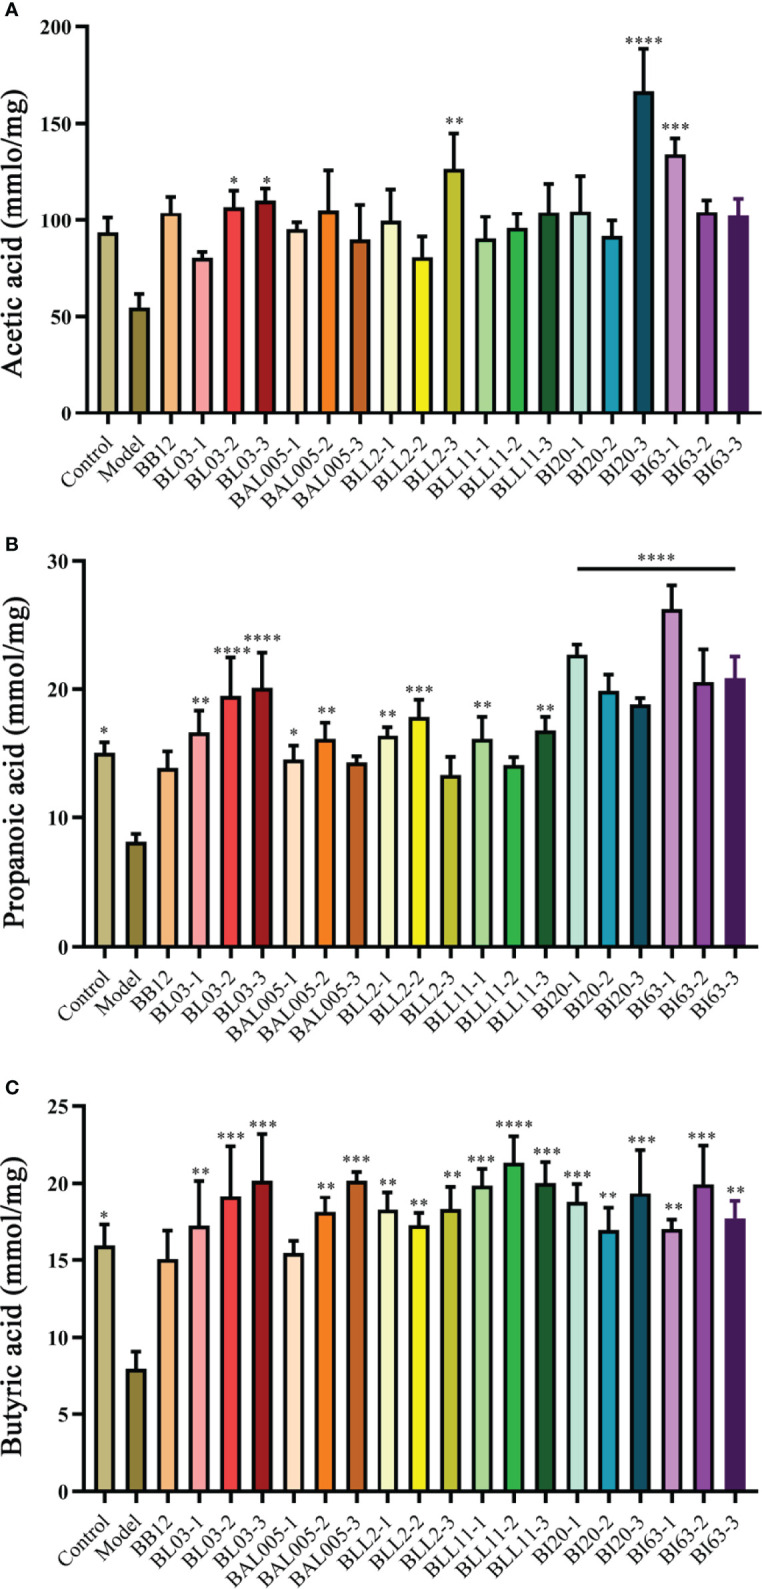
Figure 4.

The levels of SCFAs in mice feces. Acetic acid (A). Propionic acid (B). Butyric acid (C). There is a significant difference between the bacterial intervention group and the model group, where * means P < 0.05, **P < 0.01, ***P < 0.005, ****P < 0.001.
