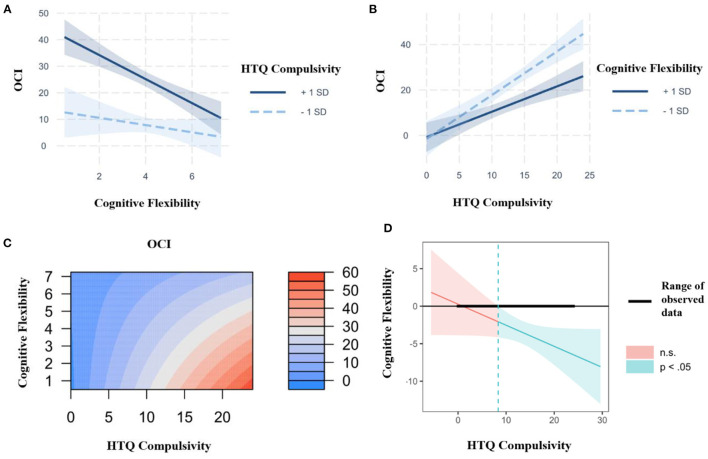
Figure 2.
(A) Interaction plot between the Compulsivity subscale of the Habitual Tendencies Questionnaire (HTQ), cognitive flexibility (as measured by the Alternative Uses Task) and subclinical OCD symptomatology (as measured by the Obsessive-Compulsive Inventory, OCI) at 1 SD above and below the mean, controlling for age, gender and educational attainment, with cognitive flexibility as the predictor and HTQ Compulsivity as the moderator. Created using the interactions and interplot packages in the statistical software R Studio. (B) Interaction plot between the Compulsivity subscale of the Habitual Tendencies Questionnaire (HTQ), cognitive flexibility (as measured by the Alternative Uses Task) and subclinical OCD symptomatology (as measured by the Obsessive-Compulsive Inventory, OCI) at 1 SD above and below the mean, controlling for age, gender and educational attainment, with HTQ Compulsivity as the predictor and cognitive flexibility as the moderator. (Created using the interactions and interplot packages in the statistical software R Studio.) (C) Representation of the regression surface predicting subclinical OCD symptomatology (as measured by the Obsessive-Compulsive Inventory, OCI) as a function of the Compulsivity subscale of the Habitual Tendencies Questionnaire (HTQ) and cognitive flexibility (as measured by the Alternative Uses Task), while controlling for age, gender and educational attainment. (Created using the visreg package in the statistical software R Studio.) (D) Johnson-Neyman plot showing the conditional relation between cognitive flexibility and OCD symptomatology as a function of the Compulsivity subscale of the Habitual Tendencies Questionnaire (HTQ). The solid diagonal line represents the regression coefficient of cognitive flexibility (as measured by the Alternative Uses Task) for OCD symptomatology along the compulsivity spectrum. The dashed vertical line at a HTQ Compulsivity value of 8.35 represents the transition from significance to non-significance. The width of the regions reflects the 95% confidence intervals. (Created using the interactions and interplot packages in the statistical software R Studio).

