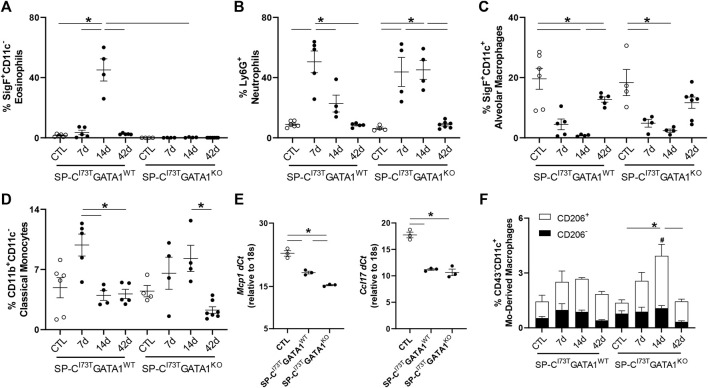
FIGURE 4.
Effects of genetic eosinophil lineage ablation on myeloid inflammatory cell dynamics following SP-CI73T induced injury. (A–D,F) Flow cytometric quantification of (A) Ly6G+ neutrophils, (B) SigF+CD11c−CD11b+ eosinophils, (C) SigF+CD11c+CD11b− alveolar macrophages, (D) CD11b+CD11c− classical monocytes, and (F) CD43−CD11c+ monocyte-derived macrophages prepared from collagenase digested lungs from oil treated controls (Ctl), or tamoxifen treated SP-CI73TGATA1WT and SP-CI73TGATA1KO mice at 7 days, 14 days, or 42 days post injury. A p < 0.05 (*) was considered significant. Lines mark significant groups. (E) mRNA analysis of BAL cells isolated from oil treated controls (Ctl), or tamoxifen treated SP-CI73TGATA1WT and SP-CI73TGATA1KO mice 14 days post injury. Data is expressed as Delta-Ct relative to 18s housekeeping gene. A p < 0.05 (*) was considered significant. Lines mark significant groups. (F) Relative abundance of total CD43−CD11c+ monocyte-derived macrophages (MoDMs) in SP-CI73TGATA1WT and SP-CI73TGATA1KO mice. Data are presented as mean ± SEM (n = 5–8 mice/group), analyzed using two-way ANOVA. A p < 0.05 was considered significant. Note that each column comprises CD206− (black); and CD206+ (white) subsets. *Identifies significant differences in the total population compared to air controls. #Identifies significant differences within CD206 subsets versus control groups. Data are presented as mean ± SEM (n = 5–8 mice/group), analyzed using two-way ANOVA.

