. 2022 May 11;11:e77019. doi: 10.7554/eLife.77019

Figure 3. Cross-species scRNA-seq profile comparison of mature oligodendrocytes (MOL).

(a–c) Uniform manifold approximation and projection (UMAP) plot of the scRNA-seq profile of MOL integrated from previously established human (b) and mouse (c) datasets. In (a), cells contributed by distinct studies are highlighted in different colors; the corresponding references are given. (d, e) UMAP feature plots highlighting expression of selected MOL marker genes (d) and transcription factors (e) in the integrated object comprising MOL of both humans (blue) and mice (orange). (f) UMAP feature plots and violin plots exemplify genes that display preferential expression in MOL of humans (PMP2, PADI2) or mice (GJC3, TSPAN2, CA2).

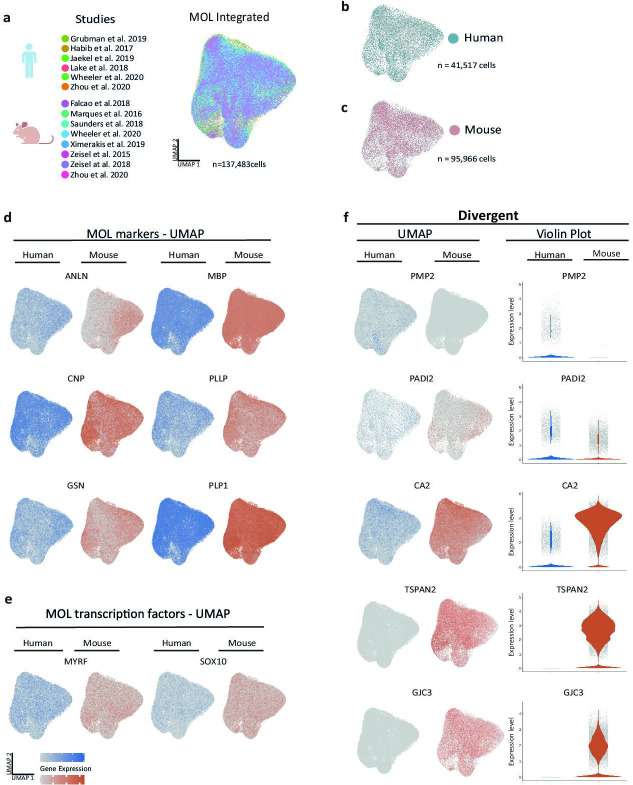
Figure 3—source data 1. Parameters applied for scRNA-seq individual dataset quality control and integrative analysis.
elife-77019-fig3-data1.docx (132.3KB, docx)

Figure 3.

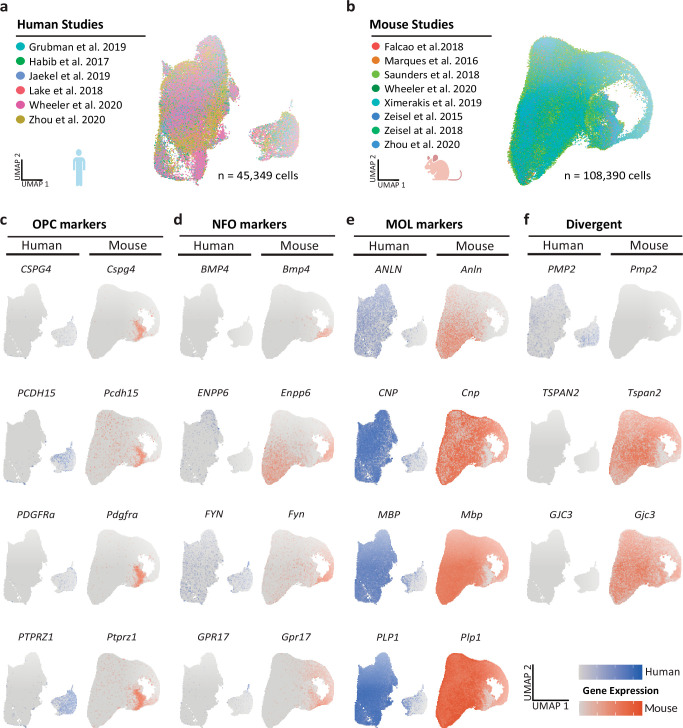
Figure 3—figure supplement 1. Integrated scRNA-seq profiles of the oligodendrocyte lineage in humans and mice.

Figure 3—figure supplement 1.

(a, b) Uniform manifold approximation and projection (UMAP) plots of the scRNA-seq profiles of oligodendrocyte lineage cells integrated separately for humans (a) and mice (b) from previously published datasets. Cells contributed by distinct studies are highlighted in different colors; the corresponding references are given. (c–f) UMAP plots highlighting expression of marker genes for oligodendrocyte precursor cells (OPCs; c), newly formed oligodendrocytes (NFOs; d), and mature oligodendrocytes (MOL; e) in the integrated human (blue) and mouse (orange) datasets. Note that some genes display preferential expression in human (PMP2, CD9, CRYAB) or mouse (GJC3, TSPAN2, CA2) oligodendrocytes (f).
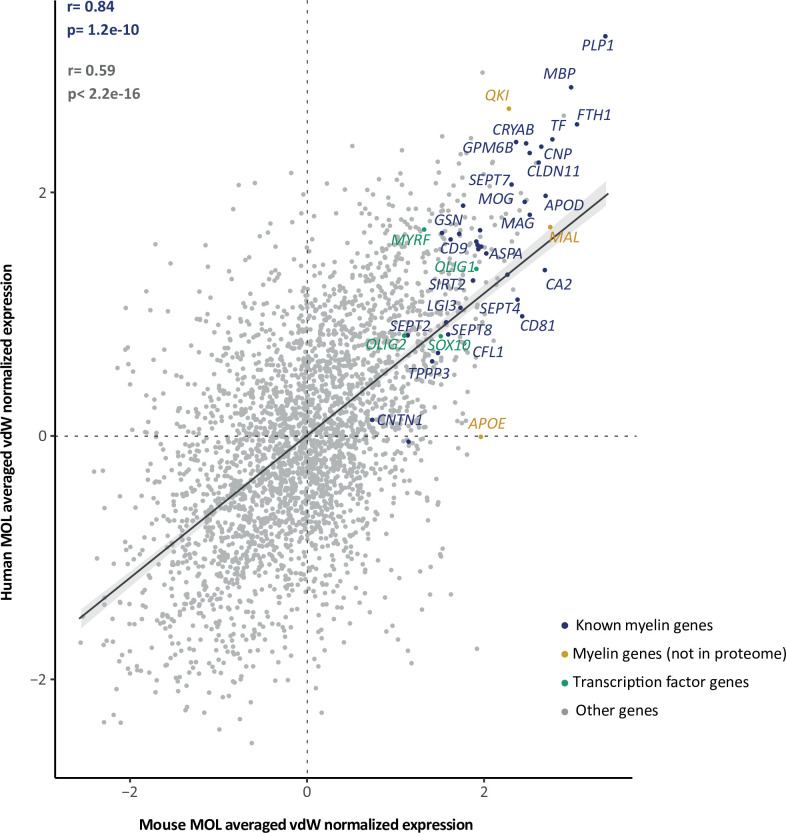
Figure 3—figure supplement 2. Cross-species mature oligodendrocyte (MOL) transcriptome correlation.

Figure 3—figure supplement 2.

Scatter plot comparing the van der Waerden (vdW) score-transformed average expression of 3000 integration features (i.e., genes) between human and mouse MOLs. Data points of 37 known myelin-related transcripts that encode proteins represented in the myelin proteome are highlighted in blue (25 of which are annotated with gene name); 3 known myelin-related transcripts of which the protein product is not present in the myelin proteome are highlighted in orange; 4 myelination-related transcription factors are highlighted in green; other transcripts are displayed in gray. Pearson’s correlation coefficient is given for known myelin-related transcripts (as highlighted in blue) or all transcripts (in gray). Regression line represents fit of data for navigational purpose.
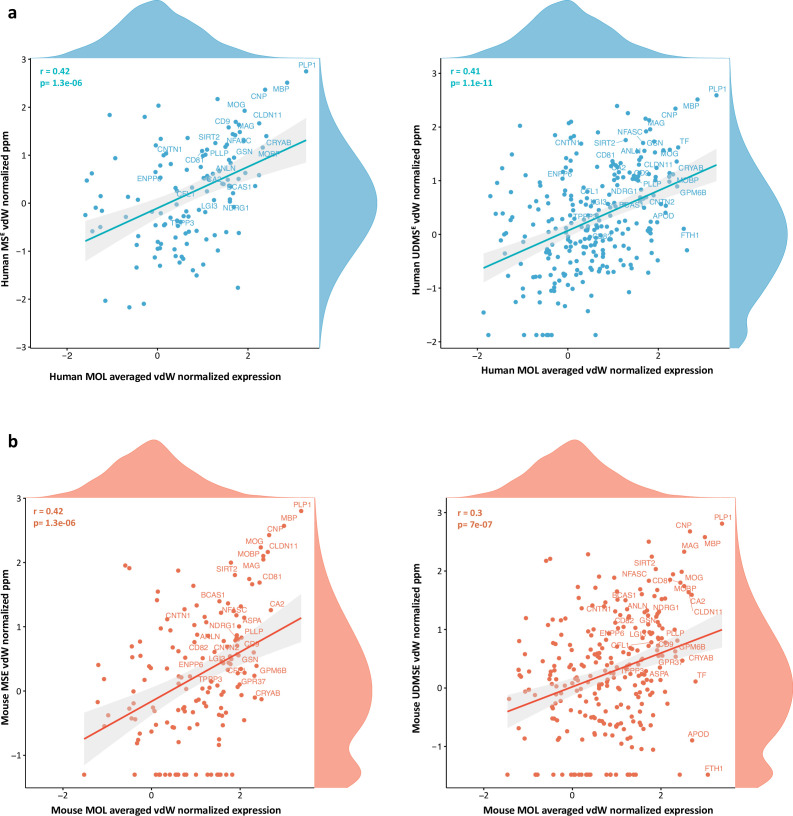
Figure 3—figure supplement 3. Comparisons of myelin proteome and mature oligodendrocyte (MOL) transcriptome.

Figure 3—figure supplement 3.

van der Waerden (vdW) scores calculated from the mean abundance of integration features (n = 3000) in integrated scRNA-seq datasets of human (a, b) and mouse (c, d) MOL, and in the central nervous system (CNS) myelin proteome in the respective species as acquired using the MSE (a, c) and UDMSE (b, d) modes. vdW-normalized data were subjected to Pearson’s correlation analysis and visualized as scatter plot. Known myelin proteins are highlighted, and the distribution of normalized protein and RNA profiles is illustrated by density plots along the axes.