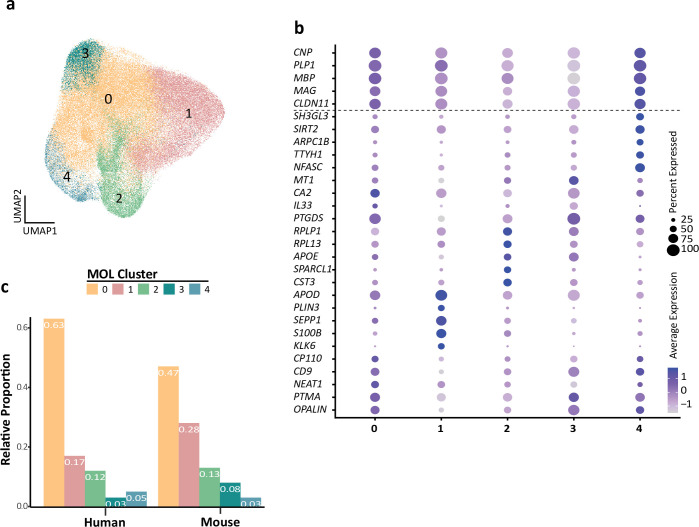
Figure 4. Human and mouse mature oligodendrocyte (MOL) subpopulation analysis.
(a) Uniform manifold approximation and projection (UMAP) plot showing five subpopulations of MOL identified upon integrating all human and mouse scRNA-seq datasets. (b) Bubble plot showing the top five subpopulation marker genes. All cells in all clusters also express high levels of known myelin-related marker transcripts (CNP, PLP1, MBP, MAG, CLDN11). (c) Relative proportion of mature oligodendrocyte subpopulations in humans and mice. Note that the MOLs of both species contribute to all subpopulations.


