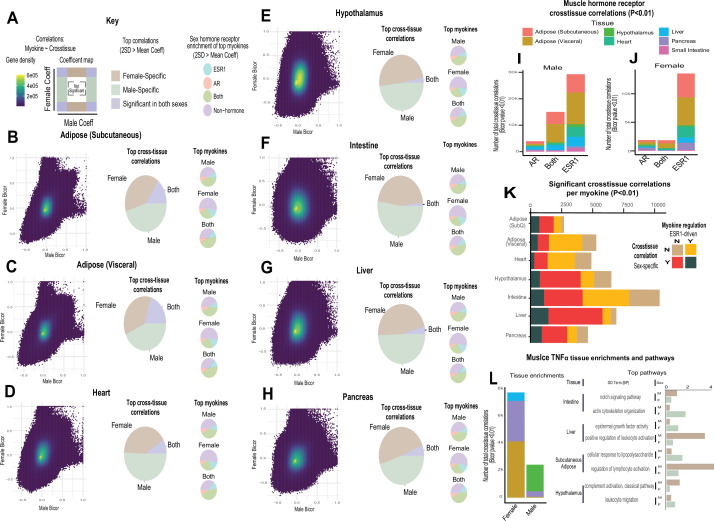
Figure 2. Sex and hormone effects on myokine regulation.
(A–H) Key illustrating analysis for distribution of midweight bicorrelation coefficients between all myokines in skeletal muscle and global transcriptome measures in each target tissue. Coefficients are plotted between sexes (left), where proportions for 2SD > mean are subdivided into occurrence uniquely in females, males, or shared (middle). The significant (2SD > mean) myokines identified in each category were then binned into hormone receptor correlations for ESR1, AR, both, or neither (right). This analysis was performed on all myokines across subcutaneous adipose tissue (B), visceral adipose (C), heart (D), hypothalamus (E), small intestine (F), liver (G), and pancreas (H). (I–J) Significant cross-tissue correlations between muscle ESR1, AR, or both hormone receptors are colored by tissue and shown for males (I) or females (J). (K) For each tissue (y-axis), the ratio of significant cross-tissue correlations per muscle myokine (x-axis) are shown and colored by categories of either the myokine regulated by ESR1 and/or a significant target tissue regression occurring specifically in one sex. (L) Number of significant cross-tissue correlations with muscle TNFα are shown for each sex and colored by tissue as in I–L (left). The −log10(p-value) of significance in an overrepresentation test (x-axis) are shown for top significant inter-tissue pathways for muscle TNFα in each sex (right).

