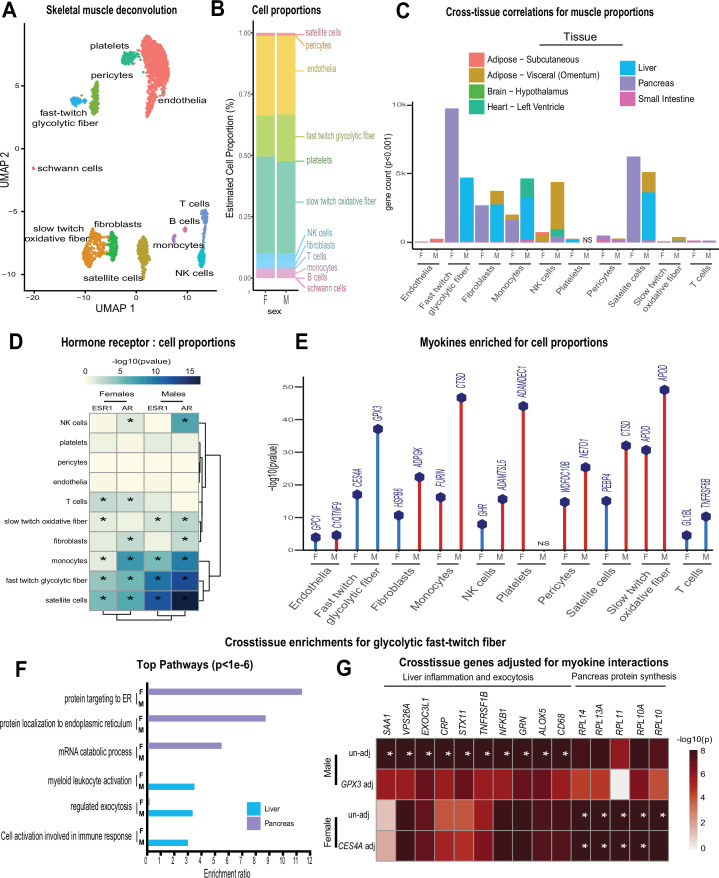
Figure 3. Genetic variation of muscle cell proportions and coregulated cross-tissue processes.
(A) Uniform Manifold Approximation and Projection (UMAP) for skeletal muscle single-cell sequencing used to deconvolute proportions. (B) Mean relative proportions of pseudo-single-cell muscle cell compositions (denoted by color) between sexes. (C) Number of significant cross-tissue correlations (y-axis) corresponding to each skeletal muscle type in each sex (x-axis). Target tissues are distinguished by color, where NS (male platelets) denotes that no significant cross-tissue correlations were observed. (D) Heatmap showing significance of correlations between skeletal muscle hormone receptors and cell proportions, * = p < 0.01. (E) The strongest enriched myokines are plotted for each myokine (y-axis, −log10 p-value of myokine ~ cell composition) are shown for each muscle proportion for each sex (x-axis). Gene symbols for myokines are shown above each line, where red lines indicate positive correlations between myokine and cell type and blue shows inverse relationships. (F) Significant cross-tissue correlated genes in liver (blue) and pancreas (purple) for muscle fast-twitch glycolytic fibers (p < 1e-6) were used for overrepresentation tests where enrichment ratio of significance (x-axis) is shown for each pathway and sex (y-axis). (G) Heatmap showing the regression significance of the top five genes corresponding to inflammation (liver), exocytosis (liver), and protein synthesis (pancreas) for proportions of fast-twitch fiber type (un-adj). Below each correlation between fast-twitch fiber and liver or pancreas gene, the same regressions were performed while adjusting for abundance of select myokines in each sex. * = p < 1e-6.


