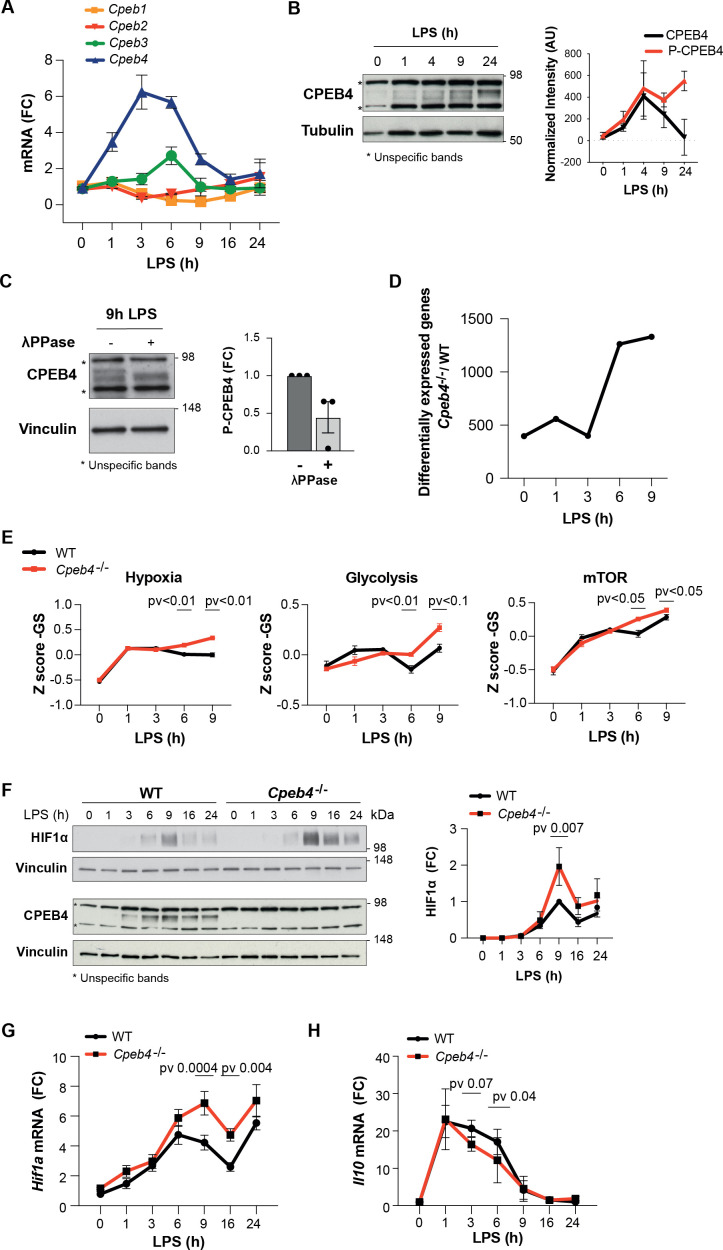
Figure 2. Inflammation resolution is impaired in Cpeb4–/– macrophages.
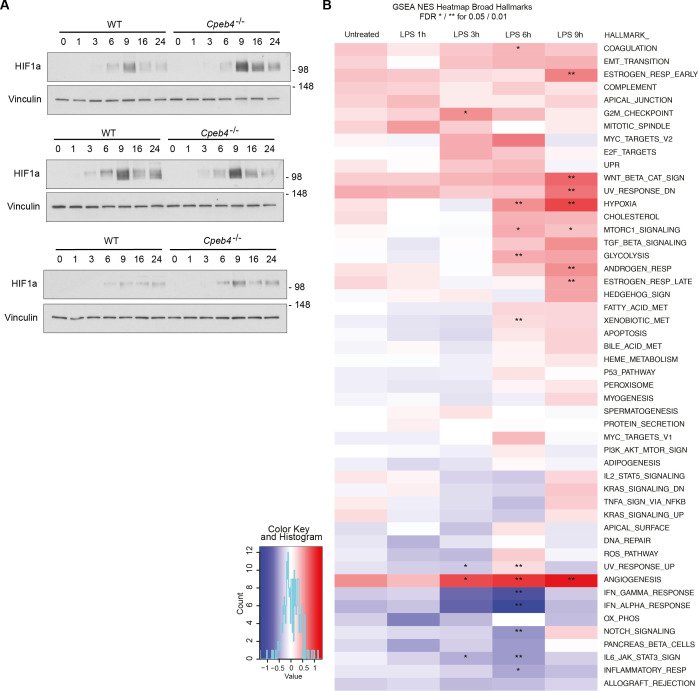
(A–C) Lipopolysaccharide (LPS)-stimulated wildtype (WT) bone marrow-derived macrophages (BMDMs). (A) Cpeb1–4 levels were measured by RT-qPCR (n = 6). (B, left) CPEB4 immunoblot, using α-tubulin as loading control. (Right) CPEB4 quantification normalized to α-tubulin (n = 3; data shown in Figure 2—figure supplement 2). (C, left) CPEB4 immunoblot in protein extracts treated with λphosphatase when indicated. (Right) Quantification of P-CPEB4 signal (n = 3). (D–H) LPS-stimulated WT and Cpeb4–/– BMDMs. (D) Number of differentially expressed genes (p<0.01) between genotypes. mRNA levels were quantified by RNAseq (n = 4). Statistics: DESeq2 R package. (E) Z-score signature of the indicated pathways. mRNA levels were quantified by RNAseq (n = 4). Statistics: rotation gene set enrichment analysis. (F, left) HIF1a and CPEB4 immunoblot, vinculin served as loading control. (Right) Normalized quantification, signal intensity was normalized to vinculin and fold change to WT at 9 hr after LPS induction was calculated (n = 3; data shown in Figure 2—figure supplement 2). (G, H) Hif1a and Il10 levels measured by RT-qPCR (n = 6). (A, G) Tbp was used to normalize. (B, C, E, F) Data are represented as mean ± SEM. (F–H) Statistics: two-way ANOVA. (D, E) See also Supplementary file 1.
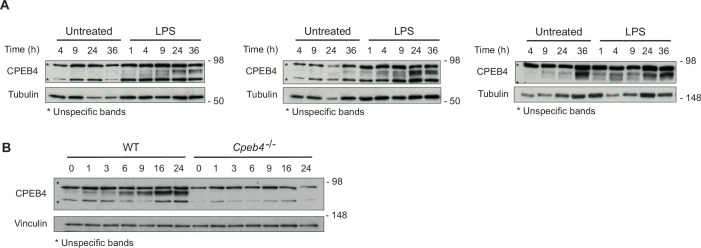
Figure 2—figure supplement 1. CPEB4 upregulation in lipopolysaccharide (LPS)-stimulated macrophages.
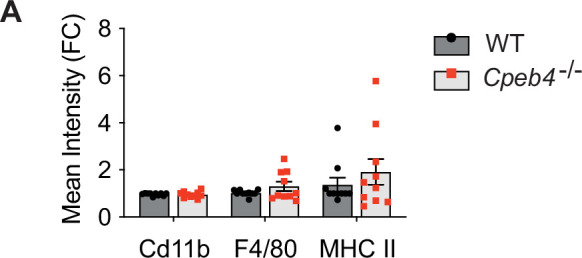
Figure 2—figure supplement 2. Differentiation of Cpeb4–/– bone marrow derived macrophages.


