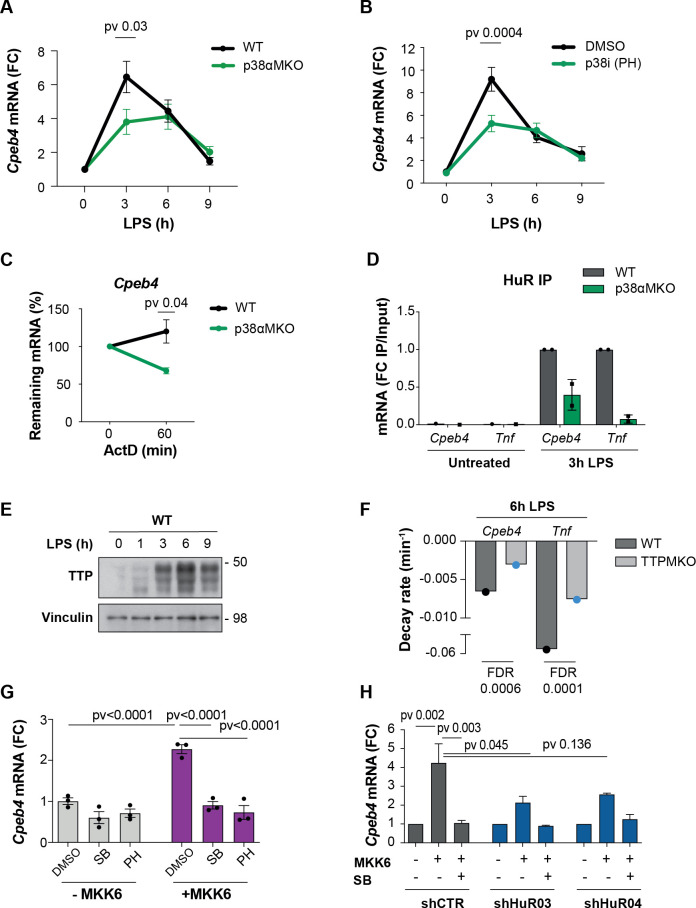
Figure 3. The p38α-HuR-TTP axis regulates Cpeb4 mRNA stability.
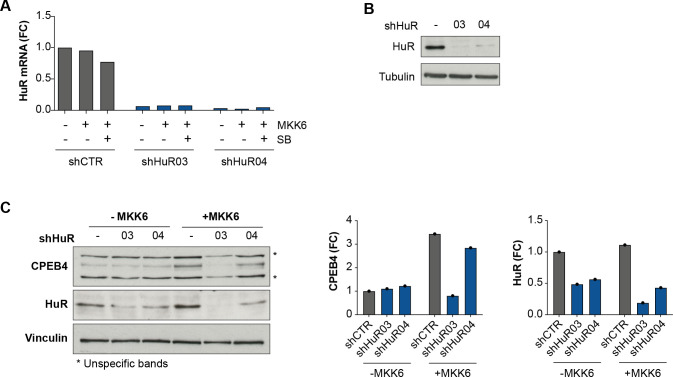
(A) Cpeb4 levels in wildtype (WT) and p38αMKO bone marrow-derived macrophages (BMDMs) stimulated with lipopolysaccharide (LPS) (n = 3). (B) Cpeb4 levels in LPS-stimulated BMDMs treated with the p38α inhibitor PH-797804 (or DMSO as control) (n = 4). (C) WT or p38αMKO BMDMs were stimulated with LPS for 1 hr; Cpeb4 mRNA stability was measured after treating with actinomycin D (ActD). Statistics: paired t-test (60 min time point; n = 3). See also Figure 3—figure supplement 2. (D) Cpeb4 mRNA levels in HuR RNA-immunoprecipitates (IP) performed in WT or p38αMKO BMDMs, after LPS stimulation as indicated. IgG IPs served as control. IP/input enrichment is shown, normalized to WT IP LPS (n = 2). See also Figure 3—figure supplement 3. (E) Immunoblot of TTP protein in WT BMDMs treated with LPS for 0–9 hr. Vinculin served as loading control (n = 2). (F) Cpeb4 and Tnf decay rates in WT and TTPMKO BMDMs stimulated for 6 hr with LPS (data from Sedlyarov et al., 2016). Data represents the mean of three biological replicates. (G, H) U2OS cells were treated with tetracycline to induce the expression of a constitutively active MKK6, which induces p38α MAPK activation (Trempolec et al., 2017). (G) Cpeb4 levels upon p38α activation (+MKK6) or inhibition with SB203580 or PH-797804 (n = 3). (H) Cpeb4 levels in control or HuR-depleted U2OS cells, where p38α MAPK signaling has been activated (+MKK6) or inhibited (SB) (n = 2). See also Figure 3—figure supplement 5. (A–D, G, H) mRNA levels were quantified by RT-qPCR. Gapdh (A, B, C, G) was used to normalize. (A, B, D, G, H) Data are represented as mean ± SEM. (A, B) Statistics: two-way ANOVA. (C) Statistics: paired t-test. (G, H) Statistics: one-way ANOVA, selected pvadj are shown.
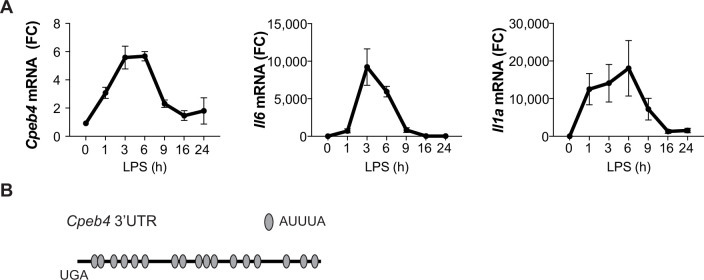
Figure 3—figure supplement 1. Cpeb4 mRNA as a target of the p38α-HuR-TTP axis.
Figure 3—figure supplement 2. mRNA stability in wildtype (WT) and p38αMKO bone marrow-derived macrophages (BMDMs).
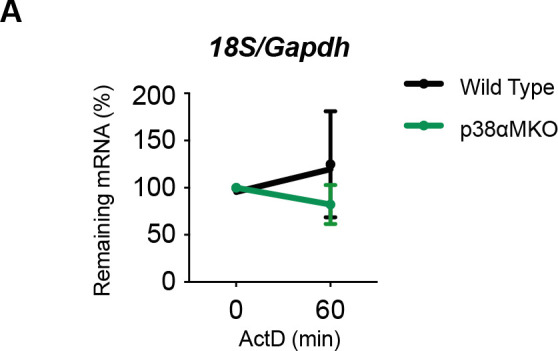
Figure 3—figure supplement 3. HuR Immunoprecipitation (IP) in wildtype (WT) and p38αMKO bone marrow-derived macrophages (BMDMs).
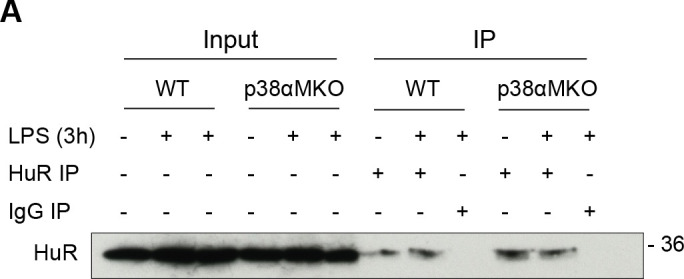
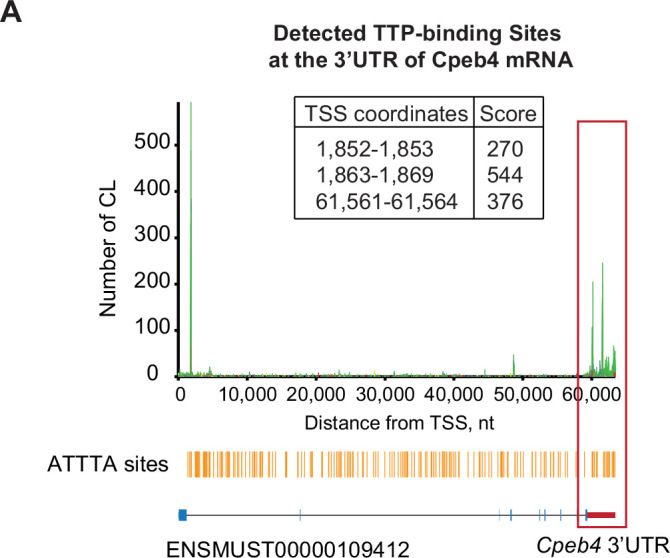
Figure 3—figure supplement 4. Tristetraprolin (TTP) binds Cpeb4 mRNA.
