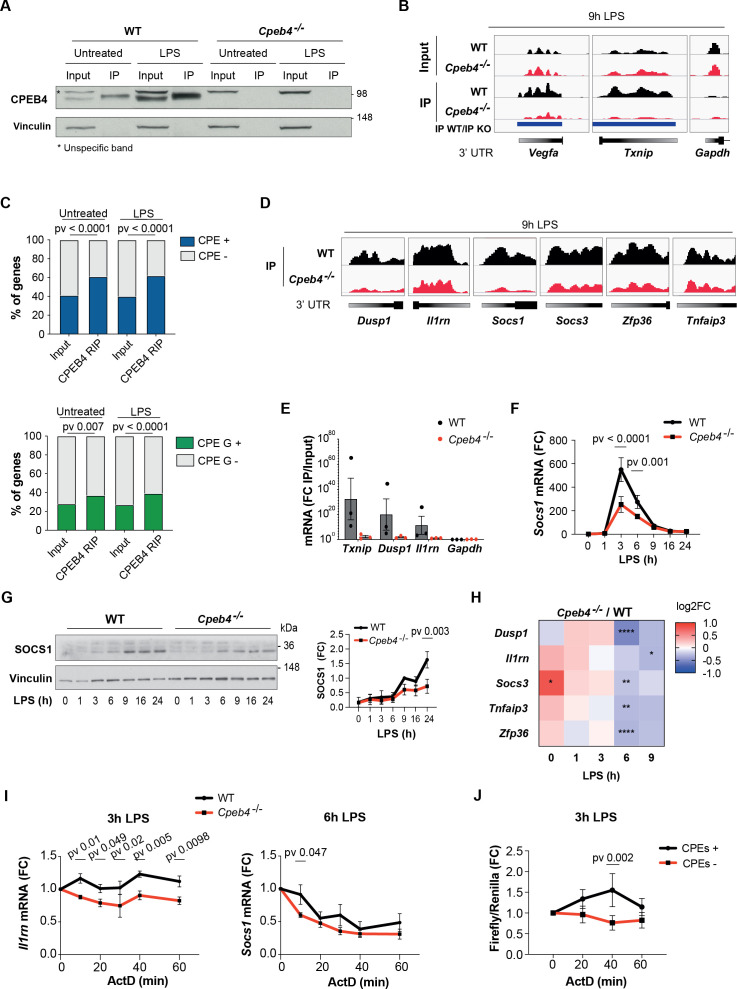
Figure 4. CPEB4 stabilizes mRNAs encoding negative feedback regulators of the lipopolysaccharide (LPS) response.
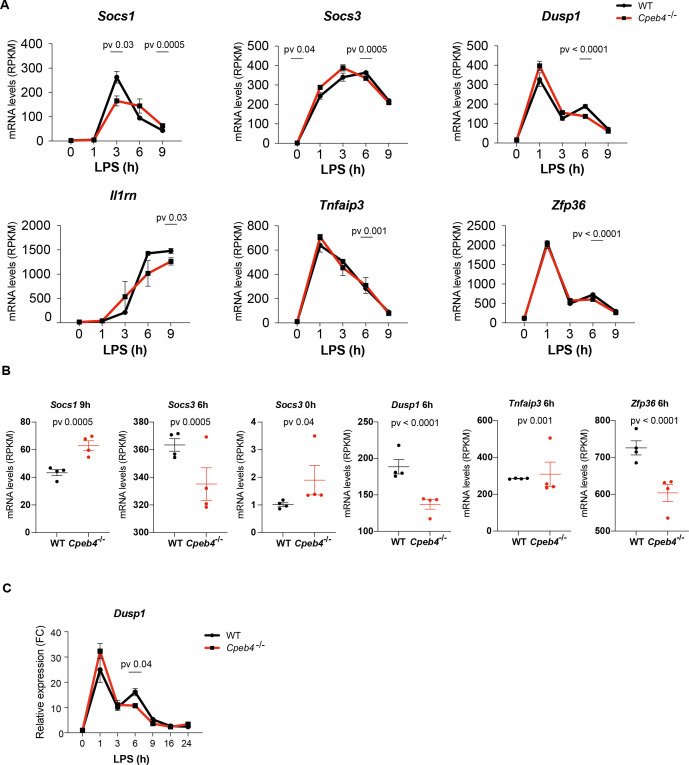
(A–D) CPEB4 RNA-Immunoprecipitation (IP) and sequencing was performed using total lysates (input) from wildtype (WT) or Cpeb4–/– bone marrow-derived macrophages (BMDMs) that had been treated or not with LPS for 9 hr (n = 1). (A) CPEB4 immunoblot, using vinculin as a loading control. (B) Examples of read coverage of input or IP of selected mRNAs. Peak enrichments between WT and Cpeb4–/– IPs are shown in blue. (C) Cytoplasmic polyadenylation element (CPE) and CPE G-containing transcripts according to Piqué et al., 2008) in input and CPEB4 IPs. The script from Piqué et al., 2008 was modified to consider TTTTGT as a CPE motif. Statistics: Fisher’s exact test. (D) Read coverage of IPs of selected mRNAs. (E) CPEB4 IP and RT-qPCR were performed for WT or Cpeb4–/– BMDMs stimulated with LPS for 9 hr. IP/input enrichment is shown (n = 3). (F) Socs1 mRNA levels in LPS-stimulated WT and Cpeb4–/– BMDMs. mRNA levels were measured by RT-qPCR normalizing to Tbp (n = 6). (G) Immunoblot of SOCS1 in WT and Cpeb4–/– BMDMs treated with LPS. Vinculin served as loading control. Quantification is shown (FC to WT, after 9 hr of LPS) (n = 3). (H) Differential expression between WT and Cpeb4–/– BMDMs treated with LPS measured by RNAseq (n = 4). Statistics: DESeq2 R package. (I) mRNA stability was measured by treating with actinomycin D (ActD) WT and Cpeb4–/– BMDMs stimulated with LPS for the indicated times. Gene expression was analyzed by RT-qPCR, normalized to Gapdh/Tbp (n = 4). (J) RAW 264.7 macrophages were transfected with a Firefly luciferase reporter under the control of the cyclin B1 3′-UTR, containing either WT (CPE+) or mutated (CPE–) CPE motifs. The same plasmid contained Renilla luciferase reporter as a control. Macrophages were stimulated with LPS for 3 hr, at which point ActD was added. mRNA levels were measured by RT-qPCR. (B, D) Integrated Genomic Viewer (IGV) images. (E–G) Data are represented as mean ± SEM. (F, G, I, J) Statistics: two-way ANOVA. See also Supplementary files 1-2.


