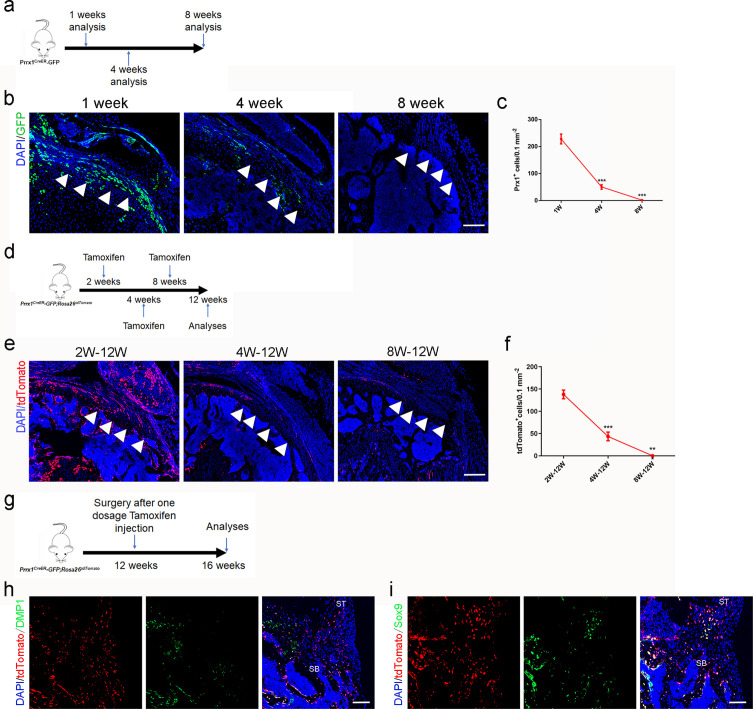
Figure 3. Prrx1+ cells are involved in rotator cuff enthesis development and injury regeneration.
(a) Schematic diagram of Prrx1CreER-GFP mice, which were sacrificed at 1, 4, and 8 weeks after surgery for immunofluorescent analysis. (b) Representative immunofluorescent images of GFP staining of active Prrx1+ cells (green) and DAPI (blue) staining of nuclei in murine humeral head at postnatal 1, 4, and 8 weeks. Scale bars, 200 μm. (c) Quantitative analysis of the number of active Prrx1+ cells in enthesis. n = 6 per group. (d) Schematic diagram of Prrx1CreER-GFP; Rosa26tdTomato mice, which were sacrificed for immunofluorescent analysis at 12 weeks after tamoxifen administration at Postnatal 2, 4, and 8 weeks. (e) Representative immunofluorescent images of tdTomato+ cells (Prrx1+ cells, red) and DAPI (blue) staining of nuclei in murine humeral head at postnatal 12 weeks after injection with tamoxifen respectively at postnatal 2, 4, and 8 weeks. Scale bars, 200 μm. (f) Quantitative analysis of the number of tdTomato+ cells in enthesis. n = 6 per group. (g) Schematic diagram of Prrx1CreER-GFP; Rosa26tdTomato mice which were received acute enthesis injury and sacrificed for immunofluorescent analysis at 4 weeks after surgery after sigle dose tamoxifen injection. (h) Representative immunofluorescent images of tdTomato+ cells (Prrx1+ cells, red) in murine enthesis at postoperative 4 weeks. Scale bars, 100 μm. (i) Quantitative analysis of the number of tdTomato+ cells in enthesis. n = 6 per group. All data were reported as mean ± SD. The white triangles indicated the area of enthesis. SB, subchondral bone; ST: supraspinatus tendon. *p < 0.05, **p < 0.01, ***p < 0.001.


